
Building Tailored Dashboards: Drill Down Visualizations and LLM-Powered Summaries with Shiny
Led by Isabella Velásquez, Sr Product Marketing Manager at Posit PBC Scenario: Imagine the weekly scramble at DemoCo. Isabella, a lonely Marketing analyst, spends hours every Friday manually compiling marketing lead performance data from Salesforce, website logs, and event records into a sprawling Excel report. The tedious, redundant process is both a time sink and a bottleneck. Marketing Leadership, who need to identify top-performing platforms, find the mass amount of information in the report confusing. They constantly return to Isabella for clarification or, even worse, don’t reach back out and make misinformed decisions on critical budget allocation. Determined, Isabella decides it’s finally time to automate and tailor this critical dashboard, and save headaches for both Leadership and herself. In this demo, you will learn how to: 1. Transform redundant, manual, error-prone data compilation into an automated lead performance dashboard with Shiny 2. Integrate diverse marketing data sources for a holistic view 3. Build tailored marketing KPI dashboards that address Leadership’s specific questions 4. Use drill-downs, data visualizations, and LLM-powered summaries to reduce data overload and clarify complex takeaways instantly 5.Provide flexibility in dashboard functionality to meet diverse preferences and needs, from pre-selected insights derived directly from the data to implementing an LLM-powered analytics option Helpful resources: 1. Demo Slides: https://github.com/ivelasq/2025-06-25_marketing-demo/blob/main/README.md 2. Demo Marketing Dashboard: https://pub.current.posit.team/public/marketing-demo/ 3. GitHub Repo (including links to packages used: pointblank, querychat, etc.): https://github.com/ivelasq/2025-06-25_marketing-demo?tab=readme-ov-file If you have specific follow-up questions about using Posit in your organization, we'd love to chat with you: https://posit.co/schedule-a-call/
image: thumbnail.jpg
Transcript#
This transcript was generated automatically and may contain errors.
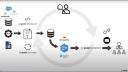
First, let's talk about the cost of manual data processing. I'm sure many of you can relate to this scenario. This image depicts an old workflow in marketing analytics. It's characterized by manual data exports, copying and pasting into spreadsheets, endless vlookups, and late nights trying to reconcile numbers.
This is Isabella. She's tasked with pulling lead performance data. Imagine she's downloading CSVs from Salesforce, Facebook ads, LinkedIn, and then combining all of this information. She's spending her valuable time as a highly skilled analyst on what often amounts to data janitorial work.
Now, I want you to think for a moment what strategic tasks are being missed while Isabella is stuck in Excel. The manual process, while seemingly just tedious and redundant, actually presents a host of critical issues. First, human error, typos, formula errors, broken links in spreadsheets. A single point of failure, what happens when Isabella is out sick or on vacation or moves to another role. Leadership frustration. When stakeholders don't get the timely, accurate, relevant insights they need, they become frustrated. They might start making decisions based on intuition rather than data, or worse, use delayed and stale insights that are no longer reflective of the current market.
They might start making decisions based on intuition rather than data, or worse, use delayed and stale insights that are no longer reflective of the current market.
Introducing the Posit tool suite
So how do we move beyond this reactive manual reporting to proactive data-driven decision-making environment? And the answer lies in leveraging the Posit team suite of tools, which are designed for end-to-end data science workflows.
Let me quickly introduce the core concepts we'll be discussing today. Posit Connect, this is your central hub. Think of it as the publishing, scheduling, and secure sharing platform for all of your data products, be it Shiny and Streamlit apps, Quarto reports, or APIs. It handles the automation and distribution. It's the integrated development environment, or IDE, for analysts and data scientists. It provides a consistent environment where you prefer RStudio, Jupyter, Positron, or VS Code. And this is where your code lives and where you develop your applications.
Quarto is a fantastic open-source publishing system that allows you to create dynamic, reproducible, and narrative-rich documents. We'll see how Quarto can script your data extraction, transform, and load, or ETL steps, as well as create custom emails for your stakeholders.
And finally, Shiny. This is the magic behind interactive dashboards. It allows you to transform your R or Python code into beautiful, user-friendly web apps without needing to be a web app developer. And together, these tools create a powerful ecosystem to solve the challenges we just discussed.
Foundational steps before building
Now, as we lay the foundation for optimizing marketing spend, we're building on two pillars, automating our data processes and tailoring our insights. However, before we dive into the exciting world of Posit tools and the technical aspects of automation and tailoring, there are three critical foundational steps that are often overlooked, but are absolutely essential for success. Knowing your audience, knowing your data, and knowing your tools. You may not have the best tools in the world, but without these foundational understandings, your efforts might fall short.
Knowing your audience is paramount. You need to understand what specific metrics or insights do they truly care about? How do they prefer to consume content? Is it a high-level summary or a static report? How often do they need updates? Delivering too infrequently can mean stale insights, but too frequently can lead to alert fatigue. Most importantly, why do they want this data? What questions are they trying to answer? And what decisions are they trying to make? Often, the why is to answer specific questions so they can make informed decisions.
And you can get started without this information, and often people do out of necessity. However, you may find yourself going back to get more or different data, or having to edit your dashboard significantly if these needs are unclear overall. Investing time here up front saves a lot of rework later.
Next, you need a deep understanding of your data. Not just where it is, but what data do you have, from what sources, do you have access to them, and are you allowed to use them for these purposes? How often is your data updated? Is it real-time, daily, weekly? Does your data ever change? Is it consistent, or can you introduce new fields at a later point? What issues does your data have? Are there missing values, biases, duplicates? And finally, how does your data tie back to your audience's questions? Is the data you actually have capable of answering their why?
Finally, knowing your resources is about understanding your capabilities and constraints. What do you have available at your organization? Do you have tools that are cloud-based or on-premise? Do you have access to Posit Team, for example? What is your timeframe for getting something delivered? Are you building a quick prototype or a robust production system? Are you working with other analysts, and do you need to collaborate? If you're working on a team, your setup will need to have version control, shared environments, and other systems for seamless collaboration, which tools like Posit Workbench are designed for.
And critically, how can you get feedback incorporated into your solution? Setting up a process for iterative feedback ensures your solution evolves to meet changing needs.
The marketing scenario and key stakeholders
To make this tangible, let's consider a common marketing scenario. We'll be focusing on lead performance reporting. Before we dive into the specifics, let's quickly align on a few key marketing terms we'll be using throughout the session.
Leads are simply potential customers who have shown some sort of level of interest in the product or the service. Lead score is a numerical rating assigned to a lead based on their engagement. It shows how likely they are to become a paying customer. Conversion is when a lead takes a desired action that moves them further down the sales funnel. And an opportunity rate is a key metric that shows how effectively we turn qualified potential deals into actual paying customers.
Now let's meet our key stakeholders in this scenario, aligning with knowing our audience principle. First up, Terry, the Chief Marketing Officer, operates at a strategic level, and their needs are concise summaries, trend analysis, and top-line KPIs delivered through daily email alerts or a weekly executive summary. They need to understand the big picture and strategic insights.
Next, we have Taylor, the Senior Campaign Marketing Manager. Taylor is much more operational. Their needs are for drill-down visualizations, the ability to see campaign-specific performance, compare different campaigns with each other, and evaluate specific content effectiveness. And they want weekly updates and ad hoc capabilities.
Finally, we have Alex, the VP of Sales. And Alex's perspective is about sales readiness and revenue generation for marketing efforts. And they care about the quality of leads, not just the quantity, and prefer daily updates, weekly updates, and ad hoc reviews.
So as you can see, these three stakeholders have very different needs, frequencies, and questions, which highlights the challenge of providing tailored insights.
Data sources and resources
Now let's look at the data sources we'll be working with, aligning with the knowing your data principle. Our core lead data, including details like names, companies, and company sizes, resides in Salesforce, which is integrated with the Snowflake database. Not to mention, there are ways of directly accessing data from Salesforce, including open-source tools and Posit's professional drivers. However, our access to Salesforce is through an API, which we found quite slow. And so we use a tool called Fivetran in order to take the data from the API and put it into a database. And we query the database and use it in our R and Python scripts. And that workflow works best for us.
Our lead quality data is currently stored in an application programming interface or an API. For our social media campaigns, we have performance data from platforms like LinkedIn, TikTok, Facebook, and YouTube. And this data is accessible via each platform's CSVs. So this is a very common scenario. Data isn't in one neat place. It's scattered across different systems and formats, posing a significant integration challenge that automation can solve.
And in terms of today's resources, we have, of course, Posit Team. Specifically, Workbench and Connect we'll be focusing on today. We have access to Anthropic's Cloud4Sonnet model for a large language model. And we have access to all sorts of open-source packages. In terms of how much time we have for this dashboard, today we're presenting it, so the time is up. In terms of the workflow, Isabella is a loan analyst, and so the workflow is tailored to a single person monitoring and setting this up. And Isabella hopes to get feedback through conversations and the Connect API, which allows her to see very detailed usage data and display that in a dashboard.
The optimized Posit automation workflow
So now that we understand the problem and the foundational elements, let's talk about the solution, which is the new optimized Posit automation workflow. Here you can see our target workflow. It's a complete transformation from the manual process. Data flows directly from its sources, Salesforce, various social media APIs, and even spreadsheets into a centralized automated pipeline. A key concept here is ETL, or extract, transform, and load, which is about pulling raw data from these disparate sources and cleaning that data, standardizing formats, things like that, to make the data actionable. And then loading the data, which is taking the process clean data to its final destination, which we will then pull into our Shiny dashboard, which we designed to be tailored to our audience and their diverse needs. And then deliver those insights to that audience via direct links or custom emails delivered in the cadence that they desire.
And this entire process, from extraction to loading, will be automated and orchestrated using Posit tools. And Isabella is now, after setting this up, outside of the process, monitoring and making sure everything goes as planned, but doesn't have to do this every single Friday, taking up hours of her afternoon.
Step 1: Connecting to data silos
So first, let's talk about connecting to our data silos. The challenge, as we saw with Isabella's scenario, is that data is scattered across various platforms, and trying to manually download and combine them is very difficult. So the solution is to leverage open source packages available in R and Python, packages designed to connect to databases, to accessing APIs securely using packages like requests for Python and Hitter2 for R. But importantly, Posit Workbench provides secure credential management for databases, so you don't have to hard code sensitive API keys or database passwords into your scripts. Workbench allows you to store and access these credential security and make your code safer and more reproducible.
So let's see what this looks like. Within Posit Workbench, I'm going to choose Positron as my editor of choice. And one significant advantage of Posit Workbench is the elimination of credential management. So I can securely sign into Snowflake via single sign-on, or SSO, and this grants me appropriate access to our data.
Within Positron, I'm going to open up my folder. And now I'll open up my Quarto doc for my extract transform load process. The setup chunk at the top handles library imports and figures the document for deployment to connect. For data extraction from Snowflake, I'm going to be using the Snowflake connector. There are various tools that exist for R and Python for database connection. And one great thing about them is that they allow you to use these languages instead of SQL. So in this case, I used the Snowflake connector in order to pull the data and then immediately transform it into something that I can process using Python pullers.
For the API integration, I leveraged Python's Redux library. And finally, for CSV files, I read them from a designated folder using a custom function. This direct approach can be particularly useful when CSVs are stored behind logins or are otherwise challenging to access. So while unfortunately, not everything can be fully automated, that is the reality of working with data often. And at least this way, we can implement a code-first development of our data so that we're not manually editing cells or things like that.
Step 2: Transforming and validating data with pointblank
So step two is where we turn that raw, messy data into something truly actionable. And the challenge is significant. You're dealing with inconsistent formats and missing values and duplicates or data that's just not structured for analysis. And you have to transform it into a clean, unified, and dashboard-friendly format. And our solution is to automate this process using a Quarto document published on Posit Connect. And so, as you saw, within the Quarto document, we've written the code to extract the data from these sources. Now we're going to implement the transformation steps after checking our data quality. And finally, we're going to load the processed data into a format the Shiny dashboard can easily consume. And Posit Connect is vital here because it allows you to schedule this Quarto document to run automatically at a set frequency, daily, hourly, whatever you need. And Posit Connect offers workflow execution monitoring. That means you can track if your ETL jobs are running successfully, how long they take, and if there are any failures, so that you can quickly troubleshoot.
So pointblank is a powerful package available in R and Python that allows you to validate your data. As you can see here, you can define your errors or warnings. Then you create a data validation pipeline based on different thresholds and different criteria. So, for example, making sure that any column that ends with underscore ID is not null, making sure that emails are valid, making sure that rows are distinct, and so on. And based on this, you can move on to the next step of transforming your data to make sure that its data quality is intact.
But to show you a quick example of how pointblank and Posit Connect work together, here is a pipeline with errors. So I have some data that I've read in, and then here is my pointblank validation pipeline. If I run this, you'll see that the results show me that there are critical validations, failures in step five and step six. And pointblank outputs this very nice table that lets me explore further and allows me to really dig into my data and make sure that everything looks correct.
But another great thing is that you can also raise an error if your quality of data does not meet the threshold that you need. So running this, we'll see that the error has been raised, and it says, validation failed, stopping render. So this halts the Quarto document in its track. And to see how this is helpful, if you embed this in your extract transform load process, say you have this deployed to Posit Connect. As you can see, there is an error, as we kind of expected. And we can go ahead and view the content, Posit Connect, check the logs, and we can see, indeed, validation failed, stop render. And if I go to my email, I will have received an email letting me know that the ETL process has erred, and I can go in and check.
And so Posit Connect offers various ways of implementing these kind of stops to make sure that your data and your workflow is executing as expected. But just wanted to show you one example that integrates the kind of data quality management that you would already be doing with your data, in addition to using errors to kind of trigger this alert so that you know you have to go in and make sure everything is all right.
Returning to our ETL. Based on the output from the data quality checks, then we can go ahead and clean our data. In this case, I want to resolve everything that came out in either yellow or red, either by filling in missing data, fixing any invalid email addresses, making sure that things are in appropriate range, and so on. And then I still have that stop in order to make sure that I am aware if my clean data is also failing.
For brevity, we're going to pretend that the lead quality data from the API and the platform performance data from the CSVs are perfectly clean. I realize that's not very realistic. But as you can imagine, you would go through the same process with those data as well, that you would validate the columns, the rows, clean them up appropriately, and set up different triggers in case something goes wrong.
And finally, the last step is loading the data. And so depending on the resources that you have, you might be loading this data into a CSV or a parquet file. You might be loading it back into a database with a view that you have control over. You might be storing it into a PIN. But in any case, you want to put that process data somewhere that your Shiny app can access. So with that, we're going to now deploy this to Posit Connect.
Within Positron Pro on Posit Workbench, we can publish to Posit Connect using the Positron Publisher. That was a lot of pages. So I click this button here and I can publish directly from Positron to Posit Connect. And it looks like a rendered Quarto document. But within this, it's doing all of the different steps that we had defined for our ETL process. In terms of scheduling this so that it runs on weekly basis or daily basis, I can go to the Settings and then say Schedule. Render on a schedule. And I can say, hey, can you please render on a weekly basis every Sunday and publish output after it is generated. You can even send emails after every update to yourself or other collaborators.
Step 3: Building the tailored Shiny dashboard
So step three is where all that cleaned automated data comes to life. Building the tailored dashboard with Shiny. The challenge here is significant. Again, we have Terry, the CMO, Taylor, the campaign manager, and Alex, the VP of sales, all with distinct needs and questions. Building one-size-fits-all reports often lead to data overload for some and insufficient data and detail for others. And so the goal is to clarify these complex insights and present them in a user-friendly way. And the solution here is Shiny.
Shiny, whether you're using it with R or Python, is incredibly powerful for creative interactive web applications directly from your analytical code. And you don't have to be a full-stack web developer to do this. So Shiny enables us to address the tailoring challenge directly with drill-downs, dynamic data visualizations, flexible user interfaces to design layouts that simplify complex information, and a cutting-edge feature LLM integration. So now your users can type a question in natural language like, what was our best-performing campaign in Q1? And the dashboard powered by an LLM directly answers the question.
Now let's take a look at our Shiny app. I want to give a shout-out to my colleague Dan Chen for creating this awesome dashboard for us. And we have this available on a GitHub repo in case you want to play around with it.
So instead of connecting to the data via databases, we're using CSVs for easy access. Please note, Shiny can connect to all sorts of data, including those in databases, and pull that data every time you open the Shiny app in order to automatically refresh. But for this example, let's keep it simple. Let's say our data is stored in CSVs. We have the modules that we need up front. And a couple that I want to highlight is ChatList. So ChatList makes talking, chatting, working with LLMs in Python very, very easy. The R equivalent is called Elmer. Of course, there's Shiny. And Shiny Express is a different flavor of Shiny for Python that makes it much more simplified in terms of building your app, which is what we use here. And then querychat. So querychat is the tool that we're going to use to embed an LLM into our app so that we can ask it questions about data.
Brand.yaml is a new way of styling your Shiny apps, R Markdown files, and Quarto documents to match your organization's brand. You use one YAML file, and your data product refers to it to make sure that it matches the theme of your organization. And next here, we define the model that we're going to use, in this case, Anthropic Cloud. And that's it. This is all you need to give ChatList in order for it to get started chatting with LLMs.
Next up, we'll want to read in our data. Add some specific fields. And so the great thing about Shiny is that it does reactive expressions. And so what that means is that Shiny understands how the different components of your app work together, and it makes sure that it only refreshes or changes or refilters or anything like that. When it has to. And so this makes for very efficient apps that only reload what it needs to, rather than everything in the app all at once.
And so then the UI elements of a Shiny dashboard are what the user sees, in this case, things like date range, the checkbox group. And just continuing to scroll down, we have things like value boxes, which highlight important values. And Shiny allows you to do things like add multiple pages. So if you have different parts of the Shiny app that you want to customize for different people. We'll see what this looks like in a second. And finally, this is the section for querychat. So with this, we're able to point our chatbot friend to a dataset that it can read and query and answer questions about. And all it takes are these few lines of code.
So moving back up to the top, let's see what this actually looks like. In Positron, I could just hit run Shiny. And I can see a preview of my app right there. Popping it out, you can see what it looks like. As mentioned earlier, we have things like value boxes that highlight specific values that we want people to be aware of. Here on the left, we have checkboxes, filters, this kind of dropdown. As well as an ability for folks to download a CSV version of the data if they want to analyze it themselves. We have interactive graphs as well.
So you can imagine, say you're Taylor, and you're interested in knowing how your campaigns are doing over time and across platforms. So this view might really interest you. You might be interested to know that LinkedIn is doing much better than TikTok. And so you would assess your priorities and resources accordingly. You might also be interested if that trend holds up in different company sizes. And you can toggle the checkboxes to either verify or confirm.
And for Taylor, this might be a great way of exploring the dashboard as somebody who really likes to explore the data. For Terry, they might be more interested in the answers to very specific questions. And so because with Shiny, you can continue layering on the different aspects of a dashboard that you need. Here we have an FAQ page that points Terry to the exact questions they are interested in. Which platforms generates the highest quality leads? What company size segment has the highest revenue potential? And Terry can open this up and see the data that directly answers his question. And the great thing is that this was built by an analyst. And so it could be highly customized to be displayed and show the information that Terry truly, truly cares about.
Introducing querychat for flexible data exploration
But let's say you're Alex. And this view, unfortunately, doesn't really work for you. You're on the sales team and it's kind of tailored towards marketing. However, you know it has valuable information. And so you might want the ability to explore this data with a bit more flexibility. And without having to go back to Isabella for every single query that you want.
For that, we introduce querychat. So this is your data dashboard assistant. It can help you filter, sort, and analyze your leads data sets. So here we have given it the one from Salesforce. And it can do all sorts of things. Like let's say Alex is interested in leads with high lead scores over 80. Click into that and run. And querychat has done the query for us. Or let's say that Alex is interested in show leads with opportunity values in the top 10%. To make sure that the team is following up on these leads. Again, querychat can help with this.
And so this allows Alex to explore the data and learn without having to go back to Isabella for every question. That being said, using AIs for data analysis is very new. And so I highly recommend setting up some norms and standards around using this technology. So for example, before Alex takes any decision on what they have seen on the dashboard, they might go back to Isabella and ask some questions and ask her to verify the information. In addition, you want to make sure that you follow your company policy in terms of data privacy. And privacy in terms of how much it costs. Every single query is going to bring up your API for some amount of money. And you want to make sure, again, that you have guardrails in place to avoid things like AI hallucinations, which can have adverse effects. So make sure that you're using this technology ethically and appropriately.
And so I highly recommend setting up some norms and standards around using this technology. And you want to make sure, again, that you have guardrails in place to avoid things like AI hallucinations, which can have adverse effects.
But just to sum up with Shiny, you can have all sorts of flexibility in terms of your dashboard. You can have interactive graphs, specified data output to answer questions. And now you can integrate with LLMs to answer questions on the fly.
Step 4: Automated scheduling and secure delivery
So step four is all about ensuring your hard work actually gets to the right people at the right time, securely, automating scheduling, and secure delivery. The challenge is still maintaining consistent timely delivery without manual intervention. If Isabella is still hitting send on emails, we haven't fully automated. And so we also want to make sure that these sensitive insights are only seen by authorized individuals. And the solution lies entirely in Posit Connect. Connect is not just a platform for deploying your Shiny apps. It's also a powerful scheduling and distribution platform. So you could send direct links to the interactive Shiny dashboard directly, say to the marketing leadership every Monday morning at 8 a.m. to give them two hours to review before their weekly meeting. And you can configure custom emails for specific stakeholders. Sending tailored HTML reports from recorded documents on a precise schedule. And Posit Connect handles all the authentication and authorization. Your stakeholders log in. They only see the content they're permitted to access. And this also eliminates emailing sensitive spreadsheets. And so also ensures that everybody is looking at the same live data.
So in terms of what this looks like, if we go back to our project, we're going to open up the leadership email. And so if you have used Quarto before, it should look very familiar. Here's the YAML heading with some metadata. And then within this email block, you add a subject and then some information. This is a very simple example, just providing the link to the dashboard. However, it is a Quarto document. So you can imagine, if you want to, you can pull in, say, a small subset of your data and use Quarto and interactive code chunks in order to produce plots that you can then send within your email as well.
We could deploy our project. Deployment was successful. You can take a look. Here, we're just seeing what is outside of that email block. But this is Posit Connect. And from here, I can do things like specify who I want to share with. And I can add a, say, collaborator. And they would be able to receive this email as well. I can customize this email. I can customize the URL if I do want to send this directly for whatever reason. And most importantly, I can run things on a schedule. So clicking here, I can say, you know, run this email every day, every week. You know, run it on every weekday, for example. And then, if I specify send email after update, I could say send to all collaborators. So say you have a specific group of people that you want to send them to. Or send to all viewers.
But say we want to see what this actually looks like. I can re-render it right now. And now I have received the email as somebody who is part of the project. You can see my subject line here. Clicking it in is the information that I provided within the Quarto document with the link to the dashboard and some contacts. Again, this is very customizable. You can add all sorts of things in order to provide this information to the specific people that we want to.
Step 5: Continuous improvement
Our final step, often overlooked, is continuous improvement. The challenge here is ensuring that your automated data product remains relevant and effective over time. Needs evolve, data sources change, new questions arise. How do you know if your dashboard is really being used, and if so, how? How do you safely empower advanced users? One solution is to leverage the Posit Connect API to access usage data. Connect logs every time your content is viewed, who views it, and for how long, so you can identify possible issues or bottlenecks and measure adoption.
One new useful feature in Connect is Connect Gallery, which is a gallery of apps, reports, dashboards, and other content that you can easily add to Connect that can help you answer questions like, how is adoption of my dashboard going? You just click this button, and it gets added to your server. So, for example, here is mine for this server. And here, I can see the different content that I've published, and then the visits by day, unique visitors, and then kind of explore more information about the usage that would help me assess, you know, which of my products is the most popular, which do I need to revisit, and things like that.
So, what does this all mean for Isabelle and your organization? A new scenario where, instead of spending three hours a week wrestling with spreadsheets, Isabelle can reclaim that time, and she's freed up now to focus on what truly drives business value, like conducting A-B tests, building predictive models, and more. Leadership can drill down into the data, ask their specific questions, and make informed budget allocation decisions based on reliable insights with on-demand tailored insights. No more waiting, no more emailing back and forth. So, by implementing end-to-end workflows with Posit Team, you are modernizing your marketing operations. Thank you, and I'm happy to take any questions now.