
Take it in Bits: Using R to Make Eviction Data Accessible to the Legal Aid Community - posit::conf
Presented by Logan Pratico One in five low-income renter households in the US experienced falling behind on rent or being threatened with eviction in 2021. Yet most are unrepresented when facing eviction in court. The complex and fast-paced legal system obscures access to timely information, leaving tenants without assistance. In this talk, I discuss the Civil Court Data Initiative's use of R alongside AWS Cloud and SQL to analyze disaggregate eviction records. I focus on the integration of RMarkdown with Amazon Athena and EC2 to create weekly eviction reports across 20 states for legal aid groups working to assist tenants. The upshot: accessible eviction data to help legal aid providers better address local legal needs. Presented at Posit Conference, between Sept 19-20 2023, Learn more at posit.co/conference. -------------------------- Talk Track: End-to-end data science with real-world impact. Session Code: TALK-1146
image: thumbnail.jpg
Transcript#
This transcript was generated automatically and may contain errors.
My name is Logan Pratico. I'm a data engineer at the Legal Services Corporation, where I work on a relatively new project called the Civil Court Data Initiative. So just to sort of start out and center this talk a little bit on the issues that I'm going to be discussing for the next 15 to 20 minutes, let's just start with, you know, what is the civil justice system?
Civil court is somewhat different from criminal court, which I'm not sure, but I would imagine a lot of you all in this room are probably much more familiar with. That's going to be the things where, you know, you commit a crime like, you know, robbery or something like that. You're often arrested by a police officer. You go to court. You plead guilty or not guilty. You're handed a verdict and then you go to jail. Civil court is a different side of that, right? So civil court is going to be the things that you're going to appear in court for, but where you didn't necessarily commit a crime. So this is going to be things like eviction, which is going to be the focus of what I'm talking about today, but also things like debt collection, guardianship, you know, cases like that, right?
These areas are slightly different, but in a lot of ways they can be equally as harrowing. So for eviction, for example, what happens in these cases can uproot a fundamental human right for a lot of individuals, their right to shelter, their right to a home. It can leave folks with forcing them to leave their sense of community, their sense of belonging. A lot of their possessions are often left behind into sort of a world of uncertainty where you don't necessarily know where you're going to be sleeping next or where you're going to be just at home next.
About Legal Services Corporation and the Civil Court Data Initiative
The organization that I work for, Legal Services Corporation, was stood up in the 1970s because, with the explicit purpose to provide legal assistance to individuals that are navigating this system, because a key difference between criminal and civil court is that folks aren't guaranteed the right to a lawyer. So that classic image that you all might have for something like law and order, where a person's Miranda rights are being read and they're being told that if you can't afford a lawyer, one will be appointed to you, that doesn't happen in civil court. Individuals are often left to navigate an incredibly complex legal process entirely unassisted. And so our goal is to essentially provide funding to legal aid organizations across the country that work to represent these individuals who qualify in court.
Now, the project that I work on within Legal Services Corporation is known as the Civil Court Data Initiative. And we essentially believe that court data, when standardized and analyzed in aggregate, can be an incredibly powerful tool in helping to allocate limited resources and finite time for these legal aid organizations working on the ground. So you can see here is our current map of coverage. This was taken from our website, which you can find the URL up in the corner there. And the first thing you might notice is that there's a lot of white on the screen. That's because we don't have all of the data yet. We have a lot of states for which we just don't know what the eviction landscape looks like.
To put that in context, imagine if we just couldn't say how many people died of heart disease every year. Imagine what that would mean for policy and just general decisions from, you know, in the medical field, all of that. That's what the eviction landscape certainly looked like in 2019 when this map was completely white. And in a lot of ways, what it still looks like today. Our goal is to be able to answer questions like, you know, how many folks, how many individuals in Virginia are facing eviction of all renters? And the answer might surprise you. There were relative to the number of renter households in the state of Virginia, there were about 12% of those were facing eviction filings. These numbers are high. And that's sort of what we're trying to present with collecting this data.
The data pipeline
To get technical for a second, and not too technical, we have our data pipeline essentially looks like this. And this is pretty simplified. But this is the basic idea. We have a data source, which for us can be court websites, bulk data downloads. You know, there are only three up here. But to put it into context, there are over 1,200 different unique jurisdictions across the entire country. And we're working to basically collect all of that data and aggregate it into a standardized system. We use a variety of sort of cutting edge data orchestration platforms like DBT and Prefect and AWS services. The list goes on and it would make me sound smarter than I am to just sort of say them out loud. But the end goal is to kind of just have a set of standardized data sets that we can put in a data lake.
And this is, you know, overall relatively simple. The idea is to basically just have queryable data that our team of research analysts and other folks can use. It can be incredibly complicated to do that standardization. But the end goal is to essentially just have databases that are accessible to folks. And what our data pipeline looked like for a while was that we were basically just subsetting that data and providing it to the end user, the legal aid organizations. This pretty much exclusively, when we were first starting out, took the form of just spreadsheets. Really boring stuff, to be completely honest.
The challenge of reaching non-technical users
I mean, I know that a lot of folks in this room are familiar with, you know, R and other data science tools. And you might look at a data set like this and say, there's a lot that I can do with that. It's standardized. It's in a long format. You know, ported into R. And you could have some visualizations going. You know, there's a lot of fun stuff that you can do with that. But remember, the folks that we're trying to get this data to aren't data scientists. They're lawyers. They don't come from that computer science or data science or even just any sort of coding background. They've spent their lives in courts studying legal text. In the same way that if you were to ask me, you know, can you tell me what like, can you just read this legalese and interpret it? And I would, you know, look at you with wide eyes. The same thing kind of happens, you know, if you give someone with a legal background a spreadsheet and basically say, you know, answer whatever question you have.
But that's kind of what we wanted to do, is we wanted to be able to provide folks with the tools to answer questions that they had. We didn't really want to answer questions for them. We just wanted to, or tell them, rather, tell them what questions they had and provide the answers. We wanted these folks to be able to basically, you know, answer questions that were specific to their context.
A story that I like to tell with this, or I don't really like to tell, but I think it's a good example here, is that when we were using this method of basically just sending off data sets to different legal aid organizations, we had for a particular grantee, a particular legal aid organization that we were working with, we had sent them a data set, and we uploaded it to Box, just as a, it was our file sharing platform. And we, you know, emailed it, sent it off. Didn't really hear back for about two weeks. And then in a team meeting, we were, you know, just internally talking about it, and we circled back. We thought, you know, whatever happened with that, did they use it? And so we went back, and we looked at that Box link, and we realized that we hadn't actually shared it externally. We had uploaded it to Box, but it was only shared within our organization. And so nobody could actually see it outside of us. And the people that were, the folks we were sharing it with never reached out to us. They never asked us, you know, they never said, hey, you know, we clicked on the link and we can't actually access it.
And I think that, you know, what better way to show that, like, the data that you're sending off isn't being used or isn't important than just the fact that, like, they can't, they didn't even try and access it, or they didn't, or maybe they tried to access it, and then when they couldn't, they didn't care enough to actually follow up. So that was a real eye-opening moment for us when we kind of realized, you know, this data isn't actually being used. We're, we have this really complex pipeline going from court website all the way to standardized data sets. It's getting 95% of the way there. But then we just weren't going the last 5%. And we weren't saying, you know, what is it that is actually going to help us to meet these legal aid organizations where they are and get them the data that they need.
We're, we have this really complex pipeline going from court website all the way to standardized data sets. It's getting 95% of the way there. But then we just weren't going the last 5%.
Switching to RMarkdown weekly reports
And that's when we sort of revised. And this was a little bit before the Quarto phase. So I know that this is a little bit crazy. So this is a little bit out of date. But we used RMarkdown to essentially generate weekly reports that took the same data from the spreadsheets that I was showing you on the last page and just put it into a really easily readable, easily digestible format that answered surface-level questions, in our eyes, sort of the lowest common denominator of questions that you could answer across all of our court data. And we provided that to our end users, to the legal aid organizations.
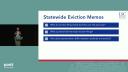
You can see here are just a couple of examples. For Vermont, you can see, you know, it has a little bit, I'm not sure if you can read that text, but essentially what it says up there at the top is just a brief introduction. We collect data across 14 counties in Vermont. And this graph generated in ggplot just sort of shows, you know, that's what the landscape kind of looks like across the board. That's what eviction filings look like over the past year. Similarly, you have an outline for Connecticut there that basically just shows, it's a heat map that just shows eviction filing hotspots. So areas in darker red are going to be areas that have the most eviction filings or more eviction filings than the areas in a lighter color red.
So yeah, so I kind of alluded to this before, but the questions that we were answering were pretty basic or trying to answer with these memos that were only, you know, two pages in length and didn't really have a lot of text. It was just, you know, what do eviction filing trends look like over the past year in a particular state? Or, you know, what counties have the most eviction filings? As well, you know, how does representation differ between landlords and tenants in these cases? The answer might surprise you. It's wide. There is a huge disparity between representation for tenants and landlords.
And really just, you know, in answering the, or in creating these memos, I just want to hammer the point home that we weren't trying to answer every question that they might have. Instead, which is something that we were doing with our previous data sets. Instead, we were just providing a taste of what we had with the data and welcoming them to come back to us, the organizations to come back to us and ask us questions and say things like, I had no, or I had some idea that my county had the highest rate of eviction filings in the entire state, but this confirms it. And I'd really like to, you know, know who the top filers are, who the top companies are that are evicting folks in my state, or what is the, what are the judgments? What are the outcomes of these cases? And what does that look like?
Outcomes and impact
And so it took us from this data pipeline to a slightly revised version where we still had the data source and the data lake, but rather than going from standardized data sets directly to the end user, essentially what we were doing was just going by way of, you know, data memos for RMarkdown and passing that along. Again, this diagram is a little bit oversimplistic in a way, because I think that it implies that we stopped sending data or spreadsheets, which isn't true. We had data memos, but we really used those as just sort of a jumping off point, as a way to get the ball rolling, to get the conversation going around sharing data.
And what ended up happening is, like I said, folks came back to us and asked us, you know, can I have this data? And then the spreadsheets that we were sending them were things that were actually important, things that they actually wanted, which is obviously always key when you're sending off data. We found that, you know, we went from sending off data that nobody had asked for and nobody was looking at, to folks actually, like, not being able to send data off fast enough. We had to grow our team because we couldn't respond to all of the specific data requests that we were getting, which is always a great thing to do.
We went from sending off data that nobody had asked for and nobody was looking at, to folks actually, like, not being able to send data off fast enough.
And so some of the outcomes from this work, there were a couple of different things. Principally, we had improved data accessibility and understanding. So, again, folks were no longer having to, you know, work in Excel to find an answer to their specific question. They could just have that analysis done for them. This also improved access via just sharing the information directly.
Beyond that, we had time efficiency. And this is both time efficiency on our end, because we weren't coming up with custom data sets to send off in anticipation of a specific legal aid organization's needs. Instead, we were zooming out to the state level and automatically generating these reports. You know, we put them on, for those of you familiar with Amazon Web Services, we put them on an EC2 instance in Amazon Web Services and kind of just let it run in the cloud. And it does that every day, or excuse me, every week. So, every Monday, I log on to my computer and just sort of double check the output of the Word documents and make sure that, you know, everything looks good. We also have more efficient tests that are running programmatically. But as a final check, that's really what I do every Monday is just over my cup of coffee, I look at each individual document and I make sure that it's looking good. And that's the extent of it. And then we can just sort of let them live there and share them and, you know, revisit things on a quarterly basis, rather than having to regenerate new documents every week or for every individual occasion.
On the part of the legal aid organizations, again, not having to do the analysis with our data, that's a huge time saver. And then the last thing is just increased conversation, which is really what our end goal is, is to be able to talk to folks and, you know, get their insight of how the data can best help them. And that's definitely a downstream of this.
So, as a recap, aggregating, cleaning, standardizing this data was really sort of the first step in the process. But we thought that it was the whole process. We thought that just if we were going to be able to collect all of this disaggregate information and, you know, like people would naturally be interested in it. And that was something that we learned just isn't the case. Instead, we had to take a less is more approach to answering more just superficial questions initially. But seeing that, you know, that would lead to increased conversation and more data sharing down the road. And in the end, this really improved engagement and understanding of the data. So, thank you very much.
Q&A
Thank you so much, Logan. We have time for at least one question. So, what are your planned or aspirational next steps for data sharing with your stakeholders?
Yeah, so that's an excellent question. So, I think that the big thing, right, is creating interactive visualizations in sort of like a dashboard format. So, we have our website, which you can see at the URL there. And we have these static memos. But the website is more of a public facing, you know, that is very, both of these are very public facing, which can limit the amount of data that we really want to publish on it because we don't want to just give out all of the data for security, privacy concerns. And so, the end goal would be to create a dashboard that allows specific folks like these grantee, we call them grantees because we do fund them. That's the main work that LSC does, is to essentially provide them with information that way, sort of more privately.