
Parameterized Quarto Reports Improve Understanding of Soil Health - posit::conf(2023)
Presented by Jadey Ryan Learn how to use R and Quarto parameterized reporting in this four-step workflow to automate custom HTML and Word reports that are thoughtfully designed for audience interpretation and accessibility. Soil health data are notoriously challenging to tidy and effectively communicate to farmers. We used functional programming with the tidyverse to reproducibly streamline data cleaning and summarization. To improve project outreach, we developed a Quarto project to dynamically create interactive HTML reports and printable PDFs. Custom to every farmer, reports include project goals, measured parameter descriptions, summary statistics, maps, tables, and graphs. Our case study presents a workflow for data preparation and parameterized reporting, with best practices for effective data visualization, interpretation, and accessibility. Talk materials: https://jadeyryan.com/talks/2023-09-25_posit_parameterized-quarto/ Presented at Posit Conference, between Sept 19-20 2023, Learn more at posit.co/conference. -------------------------- Talk Track: Elevating your reports. Session Code: TALK-1160
image: thumbnail.jpg
Transcript#
This transcript was generated automatically and may contain errors.
Hi everybody, I'm so excited to be here speaking at posit.conf, and I'm even more excited that you all are sticking around for the very last session of posit.conf.
So I work for the State Department of Agriculture in the state of Washington, and we've collected almost 900 different soil samples from all across the state. And every single one of those farmers or land managers gets their very own custom soil health report. And this is going to help them understand the soil health in their fields, and they can make decisions on how to manage their fields based on these reports, based on this data. How did we do this? We used parameterized reporting with Quarto.
So maybe you don't care about soils. I've only met one person at this conference who also works in soils. So I want to point out some other examples of how you can use parameterized reporting. So there's examples of mapping ocean floors, making fiscal briefs, or figuring out which state has the worst drivers. So there's all sorts of different ways that you can use parameterized reports.
Now why should you listen to me? I have zero computer science background, I have no coding background, but I absolutely love automating things, and I love making beautiful products. So originally, when I started at the State Department of Agriculture, I was hired as just an environmental technician. I scooped water out of streams that would get tested for pesticides. So eventually, though, I started to teach myself some basic R data wrangling and visualization, and I applied for a data scientist job in our soil section. So I went from water quality and field work to soils and data science.
And this is really cool because I got to go from picking leeches off of my boots to picking cats off of my keyboard.
So you're probably wondering now, how did I go from being a non-coder to a data scientist? And the answer is a skills test. I had the opportunity to learn something new, parameterized reporting, and demonstrate this ability through this skills test, where I had to create custom soil health reports for 86 different farmers. And I had one week to do this. I had no idea what a parameterized report was. I was kind of freaking out. I was wondering, how do I automate reports? And I sort of felt some existential dread. And I was wondering, have I made the wrong decisions in life? Am I in over my head?
But lucky for me, the RStats community is so amazing. I was able to go down so many different rabbit holes and looking at YouTube videos and blog posts. And I went through a bit of tutorial how. But that all got me to this place where I was able to create these reports with parameterized R markdown. In one week.
These are the reports that essentially got me my job and got me out of the streams and behind a computer where I get to just chill with my cats all day. And work. In case my boss is watching this.
So fast forward to two years later. We're in 2023. And we've switched to Quarto. Because I went to RStudioConf 2022 and learned about Quarto and was just so excited. So in 2023, we now have HTML reports where we're using leaflet, we're using Plotly. And now we have these cool interactive reports. But there's some people who would rather just have a physical piece of paper. So to make sure that our reports are accessible to everybody, we created these Microsoft Word outputs. Which I then manually converted to PDF. Because I didn't want to learn LaTeX. And Microsoft Word is so easy to make template reports that have just out of the box beautiful styling.
The four-step workflow
So this talk is the very last session of the conference. I'm tired. You're probably all tired. Our brains are full. So if you want to take a nap, please feel free. Because I have all the slides available at the tiny URL link in this QR code. But I'm going to have a lot of code snippets that I'm not going to have time to walk through. So I've included them. And you'll have to take a look later on in the slides.
So there's a generalized four-step workflow. From the perspective of a self-taught slash community-taught R user. Where I first had to learn what is parameterized reporting. So we'll go through a bit of parameterized reporting 101. And then we're going to talk about subsettable data. And how to get our data ready for parameterized reports. And then we'll talk about making sure that our content is interpretable and understandable to our readers. And also accessible. So our font sizes, color contrast. And for the Python users in the room, the parameterized Quarto reports can also be used with the Jupyter engine as well as the Knitter engine. So take a look at the Quarto docs for the syntax differences.
Parameterized reporting 101
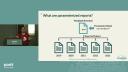
So step one is learning about parameterized reports. So what is it? It's essentially a template report where it's going to have placeholders where you can then fill in whatever values you need. So what really helped me to think of parameterized reports as functions. Like really complex functions. So imagine you have a Quarto file and you're trying to report something for every single year. So this function or this template is going to take in parameters as the function input, essentially. So if you were producing all these reports for each year, instead of going through and changing 2019 to 2020 to 2021, you're going to put in params, dollars, and year. And then the output of your function are going to be these reports for every single year without copying and pasting. It's amazing.
So for your parameterized report, you'll have a YAML header, which stands for yet another markdown language. And this YAML header is going to contain your basic metadata. So your title, subtitle, date, author, that fun information. It'll also be where you specify your format types. So in our case, we output to HTML and Word doc. And this is also where you're going to set your parameters. So these are key value pairs where you're naming your parameters. And then you're also naming the default value that it will use.
Below your YAML header is going to be your basic report content. Now how do you access your parameters? If you're working in RStudio interactively, you can run any line or code chunk. And this is going to add this params object to your environment. And then because this is just a list object, you can use the standard list notation and access these parameters with params$farmer. And then that would give you, like, Sammy Sunflower. And you can also use parameters for inline code. So if you enclose your expression in backtick R, your expression backtick, it will dynamically calculate or render whatever your parameter is. So for example, we have these are results for params$farmer, Sammy Sunflower.
Now how do you render the reports? So the fastest way to just iterate over your reports and edit and get the look and the feel right is using the IDE and using the render button. And if you hit the little arrow, you can choose between all the different outputs that you've specified in your YAML. If you like hotkeys or keyboard shortcuts like I do, you can use control shift K, and that's super helpful. And another nifty feature is the render on save option, where if you have that checked, every time you save your file, it's going to re-render that report. And then you'll be able to see your HTML preview update if you're rendering to HTML. And it should be noted that this way of rendering these reports are going to use your default parameters that you've specified in your YAML. And it's also going to have the same name and the output file location as the input file.
Now you can also programmatically render your Quarto files using the Quarto render function. And this you would include. You would run this in your console or in a separate iterate.r script or whatever you want to call it. And you're going to specify your input file, your output format type, the output file name, and then your named list of parameters. And this is especially helpful for when you want to render all of your reports at one time.
So to do this, we're going to create a data frame that has two columns. And these column names will match our Quarto render arguments. The first is output underscore file. And this will contain the file name with the extension. And then execute underscore params will have the named list of parameters. And so here's an example of code I'm not going to talk about, but you can check out later to get this basic two-column data frame that has the output files and the parameters.
And we can use the perp walk function to iterate over each row of this report's data frame. And we'll just, again, specify the input file name and the output format, which is going to match the file extension that you had in this report's data frame. And this is where the magic happens. I've heard the term magic being said so many times at this conference. It's simply amazing. But seriously, it's pure magic. So this is all the files being knit back to back from one function call. And you can see all the documents are just being populated in the files pane. It is absolutely amazing.
So this is all the files being knit back to back from one function call. And you can see all the documents are just being populated in the files pane. It is absolutely amazing.
I figured that out at about 2 in the morning. But, yeah, I figured that out at 2 in the morning, the day I was supposed to turn in my skills test. And I ran into the bedroom, and I woke up my husband, and I was just so shocked and excited.
Preparing subsettable data
So now we're going to talk about getting this data ready for our parameterized reports. So we're preparing data that is sub-settable. And this is just a simplified data frame where we have our year and our farmer. And these are, again, our parameters and some example data. And, yes, thanks, ChatGPT, for the punny farmer names.
So you can use these params as basic values. So here we're just using declier filter and then setting our farmer equal to whatever that params value is. So we're doing some data wrangling here and creating a new column called category. And for each farmer that is being the report is being rendered for, that value would be your fields. For any samples that are in the same crop, it would be same crop. And then any other project, any other samples in the project would just be called other fields. And this is going to come in handy when we do our visualizations for our reports.
Creating interpretable and accessible content
So now we're going to create our content. So we want to make sure that it's easily consumed by whoever we are sending these reports to, that they're able to understand and make decisions based off of what you're showing them. So one way we did this was creating these static plots and interactive plots for HTML format. But we're now using that new category column. And we're styling each point so that it's really clear to the farmer which are their fields, which points are the fields that are in the same crop or the same county, and then just the general distribution of the project. And this helps people to interpret their data based on comparing it with other points.
So we also want to make sure that our reports are self-contained. So we want to make sure that we are providing all the content for our readers to really understand the results that we're showing them. So we included about 30 different soil health measurements. And instead of including 300 lines of just regular text and prose of what these measurements were, we can use an includes shortcode that's actually going to just embed this other Quarto document that's called soil health measurements into the parameterized parent Quarto file. And it makes it so easy to reuse information across your different reports. And it shortens your main document.
And I also mean self-contained in the more literal sense for the HTML reports, where we want to make sure that we can just send the HTML file, email it, whatever, and then the recipient can just open it off the bat. And so to do this, we'll do an include in YAML, or we'll do embed resources true in the YAML header. And what this is going to do is make sure that all the data, images, stylesheets, et cetera, are embedded into that file. Because otherwise, Quarto is going to give you a underscore files folder that has all of those external dependencies. And if you send that with your HTML file, no one's going to know what to do with it. So make sure you embed. And then also, make sure you're mindful of size. So if you are doing these self-contained reports, don't make them too big that you can't email them.
And then designing for accessibility. So I already talked about how we created HTML reports and PDF reports. So Quarto makes this really easy by using these divs, where we can use this content visible when format is HTML. And this is really helpful when we want to use panel tab sets for just our HTML reports so that we don't have to have a whole long list on our HTML file. We can have tab sets for each category of our soil measurements. And for non-HTML files, we can use the content visible unless format HTML div. And now we just have our background information and a regular list of definitions.
We also can use conditional code evaluation, where the code will only be evaluated if the output format is met. So, for example, if we wanted plotly code only for HTML or ggplot code for anything else. To do this, we're going to set an output format type in our setup chunk using this knitter ops knit get function. And then we can use this out type variable value in our eval chunk option. And now we're including both of these code chunks in our document, but only the code chunk that has that eval evaluated to true will actually render and be included in your report.
So, here's some tools for styling and picking your colors and contrast. And you would include this in your YAML header for HTML output Word document. And these are listed in the resources. And I don't have time to talk about the browser developer tools. But this is here for you to double check your contrast ratios for your HTML reports. And what's really nifty is if you click on it, you can actually adjust the colors.
So, the end result, though, is everybody gets their very own custom decision support tool. So, that's essentially what parameterized reports can be if you design them right. And provide all the context that's needed to understand those results.
So, the end result, though, is everybody gets their very own custom decision support tool. So, that's essentially what parameterized reports can be if you design them right. And provide all the context that's needed to understand those results.
So, to recap, we learned a little bit of parameterized reporting 101. We saw that we can just use our data that has columns for each parameter. And then we made sure that our content is easily understandable and is accessible to all of our audience. And now, because we didn't copy and paste, we didn't do each of these reports manually, we now have time to take a cat nap, watch TV, hang out, or work if my boss is watching this.
So, I promised you seven slides of resources. So, I have all the resources that well, not all. Well, not all. A curated list of resources from my immense times of going through all these different rabbit holes. So, there's the Quarto docs and videos, tutorials, examples, videos, style sheets, accessibility tools. And I would love to connect with you over my favorite things. Cats feature are in Quarto. And I'm sure we're all feeling like this and ready to go home. Thank you.

