
FOCAL Point: Utilizing Python, R, and Shiny to Capture, Process, and Visualize Motion - posit::conf
Presented by Justin Markel & Alyssa Burritt One of the fastest movements in modern sports is a golf swing. Capturing this motion using a high-speed camera system creates many unique challenges in processing, analyzing, and visualizing the thousands of data points that are generated. These spatial coordinates can be quickly translated through Python scripts to well-known, industry-specific performance metrics and graphics in Shiny. Down the line, R utilities aid more complicated analyses and optimizations, driving new product innovations. This talk will cover our company's process of implementing these tools into our workflow and highlight key program features that have helped successfully combine these applications for users with a variety of technical backgrounds. Presented at Posit Conference, between Sept 19-20 2023, Learn more at posit.co/conference. -------------------------- Talk Track: R or Python? Why not both!. Session Code: TALK-1120
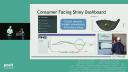
image: thumbnail.jpg
Transcript#
This transcript was generated automatically and may contain errors.
Hello everyone. Thanks for sticking around and being with us today. Justin and I are super excited to be giving this talk. So we'll go ahead and kick things off by sharing how we use Python, R, and Shiny to capture, process, and visualize motion in our FOCAL system at Ping. So if you're familiar at all with Ping, you might think of us as a golf company, but what we really are, are an engineering company that just happens to make golf clubs.
With every product, we ask ourselves, how can we use our knowledge of physics and engineering principles to improve golf club design and ultimately people's enjoyment of the game? So the process of making a club from an idea to manufacturing it to ultimately putting it in a player's hands has changed greatly since our company's inception almost 60 years ago. So today we're going to talk a little bit about how the tools in R, Python, and Shiny have made this process more streamlined for both our external consumers and our internal engineers.
The research question: which golf shaft is best?
So to sort of walk through this entire workflow, we can give an example research question that we might have, such as, which golf shaft is best for a player? So to sort of give a wide overview, if you're not familiar with golf, a golf shaft is the component of a club that connects where a player grips it at the top of the club to the club head at the bottom. We typically characterize them by a property called flex, where on one end of the spectrum we have like a regular flex. The properties here is that it typically flies higher and is used by players who swing a little slower. And on the other end of the spectrum, we've got an extra stiff flex. It typically flies a little lower and is used by players who swing pretty fast. Those are all sort of like general knowledge nuggets. But how do we know if this holds for a specific player that we're trying to fit?
So to give an example of this concept of flex, we have a few pictures here of our co-worker Chris. Chris happens to be one of the faster swing speed golfers at Ping, and he loads the club with a ton of force in his downswing. So this is after he's taken the club back from address to kind of the top of his backswing here, and just as he's getting ready to transition to bring the club down towards impact. Now, when we give Chris something that's in our softer flex or regular flex category, he's going to create a lot of deflection. So the club is going to flex a lot. And when we give Chris something that's in our extra stiff flex category, he's going to create very little deflection. Now, to an extent, Chris is a bit of an outlier in terms of the general golf population with how fast he's swinging or how much he's loading the club here. But the important thing to consider is that all golfers load the shaft and load the club differently at this point, and these loading patterns should be well understood and measured to answer the question of which golf shaft is best for this player.
Introducing the FOCAL system
So we're going to showcase how we utilize our high-tech motion capture system that we call FOCAL and leverage Posit Connect to answer this question. So FOCAL is probably the most high-end and in-depth research tool that we have at Ping, and it essentially allows us to track the golfer's swing from the time they address the ball through that loading phase to just after impact. And we're doing this by tracking some small reflective markers that we place along the club head and on the shaft to model the club as a body as it moves through space. FOCAL is quite a bit different than some of the other performance measurement systems in golf. If you've ever watched golf on the weekends, they have the launch monitors that are kind of tracing the ball flight and what the ball is doing. But with FOCAL, we can actually see exactly how the golfer manipulated the club and got to impact.
And to give some context to the amount of data that we capture with the system, every swing that we take generates around 40,000 data points, and that's raw positional data on all those little markers, some velocities and accelerations of the club head and the shaft, and then even metrics that compare those two together. And we've had a motion capture system at Ping since 2011, and in the last 12 years, we've had the opportunity to capture over 75,000 swings on the system. And this data set ranges from tour pro golfers to collegiate golfers to golfers at Ping that are scratch handicap and golfers at Ping that swing a club maybe once or twice a year. All of this data really helps us drive new product innovations and insights that consumers will see in products in the marketplace two, three, and even five years down the road.
All of this data really helps us drive new product innovations and insights that consumers will see in products in the marketplace two, three, and even five years down the road.
From static workflow to Posit Connect
Now prior to leveraging Posit Connect and kind of the Shiny framework that we're using today, our workflow was pretty static, and it looked a little bit like this. We would capture data with the system, we'd export that data to a very flat CSV, and we'd store the data in a super flat table database. And then we would pull down that data in Excel and do a lot of our analysis on very discrete insights in maybe an A-B test scenario where we're trying to compare one club and how much it flexed on average to another club or how fast one club moved relative to the other club in that test. And these discrete insights are great, and they especially help us when we're trying to design new clubs, but unless you were one of the key stakeholders that was really in tune with the motion capture system, it was a little bit harder for everybody in the company to access the full swing data, kind of that time series data, and leverage the power of that full swing tracking that we're getting. And we wanted a way to make this better.
So today, our workflow with Posit Connect is much more powerful, it's much more streamlined, and it's much more dynamic than it has been in the past. And it looks a little bit like this. So again, we start by capturing data. We're doing the bulk of our processing of all that raw positional data in Python. Those Python scripts are run directly in the motion capture software itself, and we're using some packages like OpenCV to actually spatially map impact and identify where impact happened. Impact is kind of our key event to classify a swing there. All of our swing data is then exported into a JSON file format, and those files are then uploaded to our much more structured relational database that we're interfacing with via APIs. Some of those APIs go to feed our physics-based models, and from those physics-based models, we're actually able to directly generate a lot of our engineering insights.
What's cool for us here is that we can take those insights that we generate and turn them into plumber APIs that feed and power our consumer-facing apps and tools. We're generating a ton of internal reports via our markdown documents to give to engineers on more of a test level or key stakeholders that want to see certain data points in the lab. And we're heavily leveraging the Shiny Dashboard framework that's powered by things like the tidyverse and future and fur to do some cleaning of that time series data and then also some parallel processing and computing of that time series data to bring it down a lot quicker and make it very accessible. All of this ultimately leading to that shaft recommendation for the player.
The Shiny dashboard in the lab
So I'm going to zoom in a little bit on what one of these Shiny Dashboards might look like in the lab and kind of walk through that process. And what's powerful about the Shiny Dashboard framework for us is that it allows us to extract these very dynamic insights almost immediately following a swing. So we can have a player come into the lab, take a series of swings, and then we can look at things like where that player hit the ball on the face of the club and go through some of their impact location tendencies with them. And then we can pull in that time series data and talk through where we see the club bending, how we see it bending, where we see it loading the most, and what this means for the player and their swing. And this allows us to take this really complex positional data and all these other data points and translate it in a way that the player and the coach understand and give them some of that feedback. And we can go through, try several different things in the lab, and open up that feedback loop to help them take this and make action on it.
We can further take that player's specific data and compare that player to maybe a population of players on some density charts here. And then we can take that player's specific data and combine it with the insights that we've generated behind the scenes to ultimately lead to that shaft recommendation. And what we love about this is that we're not just communicating a shaft recommendation to the player, but we're actually able to use the data to inform the player why we believe this shaft will help them play their best on the course. And it's fun to be a part of that and see how it really takes over in their game.
Research analysis and statistical tools
All right. Now, from a research perspective, we can take a step back and look at all of the data that FOCAL collects. We can move past that first step of identifying which shaft produces the best performance outcome for a player and move on to the possibly more complicated analysis as to why. So, does changing the flex of the shaft meaningfully change how that player swings or how they orient the clip they set impact? And if it does, how can we quantify these changes and use them to drive our design and fitting principles?
So, in this, we can consider a sort of recent player test that we run within our FOCAL system where players hit two clubs. One was a regular flex shaft and one was an extra stiff flex shaft. So, as Justin mentioned before, a test like this with 20 players will generate a massive amount of positional data for each of the markers on the clubs. We're going to go through that sort of workflow that he just talked about and put together a sort of nice little summary file for some of our engineers and stakeholders in the test that include the swing and performance metrics for every shot for every player. But some of our design engineers that maybe weren't as heavily involved need something that's a little easier to process visually. So, it helped them see both a player shot-to-shot variation between the two prototypes as well as the player-to-player variation within the test. We can utilize Shiny and then the Posit Connect to create an app where any engineer can go. They can select a test, maybe a player or two to compare and look at specific metrics.
So, this is an example of what a dashboard might look like. As you can see, it does report some like discrete metrics because our engineers do care about these numbers still and they are very useful to them. Something that's great about Shiny though is it allows for an even greater visual effect for that transient data. So, you can see these are two different players that were in that test and we can produce these graphs using the tools available on packages like gghighlight and ggiraffe. This gives engineers insight on how a player reacts to the club within the timeframe of the swing. So, something in golf that's really cool is that regardless of a player's skill level, everyone's swing is very unique and different. So, these two players that we have graphed here are both very highly skilled, but we can see that both the magnitude, the maximum result in shaft flexion that we see and the time that it occurs in the swing are very different. So, this sort of information being able to visualize the FOCAL data in this manner is really nice for our engineers and allows them to easily determine like where they should focus their research and development efforts.
So, this sort of initial analysis and visualization is great for a specific test, the results of a single test, but what if we want to use this data in the future or look at the results of many tests? That's where R steps in and provides a sort of statistical framework that we need to analyze 10, 15, 20 years' worth of player testing data. So, within this, we can see patterns emerge from prototype to prototype or patterns emerge out of specific player groups that we're testing. So, kind of continuing our example from the shaft test, and if we want to run a basic statistical analysis, we can run an SPM test on those two players. Here, the gray section represents a sort of significant difference that we see, and so what we can get out of this is that there's, they're very different throughout the entire swing except for a period kind of, you know, in the middle part of their downswing and then at impact. So, there's no statistical difference or significant difference between the two shafts at impact. This is a really important finding for our engineers.
That's where R steps in and provides a sort of statistical framework that we need to analyze 10, 15, 20 years' worth of player testing data.
Additionally, we can use the tools available and the DevTools package to create our own packages within Ping for all of the physics-based modeling and simulation that we do for club golf ball impact and golf ball flight, and then using these packages in conjunction with all of our historical testing data allows us to conduct virtual player tests where we can simulate how players will react to and perform with clubs without having to physically prototype them or run any tests. This is great for us and saves us time and money.
So, now I've sort of covered our complete workflow with FOCAL from capturing and processing every data point with our cameras, going through Python, and then producing consumer and internal facing apps with R and Shiny. The combination of all of these programs with Posit has really allowed our company to streamline our research and development process and make it very smooth. So, thank you for attending. We're happy to be here and take any questions.
Q&A
All right. People in the crowd are asking the hard-hitting questions. Can you help them break 90? We'll do our best. We will. Come see us in Phoenix. And on your databases, what kind of databases are you guys using for this workflow? That's a great question. We've got a software engineer that's built a database with more of our IS team. I'm actually not involved with our IS group, but I know that we have two or three people that have built some pretty extensive databases for us. Awesome. Do you know at least if like they're a cloud database? They are cloud. Yeah. Very cool.
So, the question is, how do you sync the time between those swings to make sure you're kind of starting at the same point? So, the data that gets taken out of FOCAL and processed through Python, we can then take that into R and mark specific times in the swing. So, a couple of the times that we mark are when they start the downswing and when they hit the ball at impact. So, depending on how fast a player swings, the amount of time that passes through that time frame will be different. And so, we can mark a start position and end position and then look at the relative time difference. And so, then what those charts showed were the relative. So, like the percentage of the swing that has been completed between those two points, if that makes sense. And all that's done in R. Awesome. Thank you so much. Can we give another hand for our speakers?