
What's new in the tidyverse? by Professor Mine Çetinkaya-Rundel

image: thumbnail.jpg
Transcript#
This transcript was generated automatically and may contain errors.
All right, thank you very much for having me. I cannot believe I'm here. It's so far away from where I live, but also so exciting to be here. So thank you so much to Monash University for having me out for the next two weeks. And I'm really glad that the timing worked out to be able to give this talk today. So today I want to talk about what's new in the tidyverse.
As Emi mentioned, I work with the tidyverse team pretty closely, mostly in terms of sort of developing educational materials for it. But oftentimes, developing educational materials after something is built isn't necessarily the best way to go about things. So I very much enjoy being able to sort of be involved with the development process, thinking about things from the perspective of learners and educators.
So I'm going to talk a little bit about, very quickly, about the tidyverse. I assume a lot of you know about it. But turns out it is more than just those cute hex logos that we saw here. Yeah, that's like one perk of working at Paws that you can always get these hex stickers.
Tidyverse principles and overview
Okay, so let's talk a little bit about the principles of the tidyverse. So tidyverse itself is a meta R package that loads nine core packages when invoked. And what's special about these packages is that they share a design philosophy, a common grammar, and data structures. So this is what it looks like when you first load the tidyverse. And when we think about this sort of figure for data science in terms of the data science cycle, we can see that many of these packages map on to many of the steps of the data science cycle.
I'm going to use the Palmer Penguins dataset, the Penguins dataset from the Palmer Penguins package for some of my examples here. And for those of you who may not be familiar with it, it is a dataset of a little over 300 penguins, and we have some body measurements on them that are numerical variables and a couple of categorical variables like species, island, and sex.
And this is what a typical tidyverse pipeline looks like. So you can see that we start with the data frame, we do some stuff to it, and then we visualize it. And this is what a typical tidyverse workflow looks like. You start with a data frame, and then you say, I want to group my data by species and sex, and then I want to, let's say, calculate the mean body weight of these penguins. And then you realize, oh, there's a warning, I wonder what that means, or a message, and then you sort of adjust to it.
And then, now that I have a data set that I can visualize, I can pipe this into a visualization sort of pipeline and make a bar plot. And that bar plot doesn't really make a whole lot of sense to me. Maybe something like this, where the bars are dodged, makes a little bit more sense. Frankly, as a statistician, these sorts of plots really bother me, where you're sort of plotting the mean without any sort of data about the variability within each of these groups.
So let's keep that in mind, and let's talk a little bit about what I'm going to talk about in this presentation. Sometimes I'm going to show you a slide that looks like this, where it says, previously, you used to do this, and now you should do this. But most of the time in the presentation, I'm going to say, previously, you used to do this in the tidyverse, and now you can do this. And you'll see that the latter will be a lot more often.
So while I'm talking about the updates to the tidyverse, I'm not mostly talking about changes to the tidyverse, where you absolutely have to change your code. It's just sort of quality of life improvements, mostly, for you to either make your code more readable or more efficient, or some combination of those. And because I can't help myself, I'm going to sprinkle in some teaching tips along the way as well.
Tidyverse 2.0 and lubridate
So let's start with tidyverse 2.0, which was released this year. And there are two things in this meta package that are new. One is the lubridate package is now a core tidyverse package. And the other one is that package loading message got even longer. So let's take a peek at what those are.
The lubridate package is an incredibly useful package with a incredibly not-so-great name, in my opinion. But it is a package that makes it really much easier to work with date times. So maybe previously, you used to do this at the beginning of your R scripts or documents, and now you can just get away with doing this, just the library tidyverse.
And this is what lubridate functionality looks like. I'm going to give sort of three progressively, I think, more annoying to parse strings. One of them is just today's date as a numeric value, the other one's a text string, and the other one is an actual sentence. What we can do is we can take each one of these and apply the appropriate lubridate function. So in this case, the data is in the order of year, month, and date. So then I apply YMD, and we can see that it turns it into a date class.
I can do the same thing where the data is in the order of MDY. Or I can say, just take that sentence and figure out in there a date, month, and year, and an hour as well. And it does a pretty good job of doing so. And you can also supply time zones to it, if that's the sort of thing that you tend to work with. And if so, I am sorry. And then it will give you a POSIX CT class.
So this is, I think, pretty neat. And what is really neat about this is that particularly for that last example, it lets you get away with not having to write regular expressions. And to me, that is a huge quality of life improvement.
And what is really neat about this is that particularly for that last example, it lets you get away with not having to write regular expressions. And to me, that is a huge quality of life improvement.
The conflicted package
The other one is that message that I said got longer. So when we load the tidyverse, now we can see an additional informational point that says, use the conflicted package to force all conflicts to become errors. So what does that mean? It basically, we can explicitly check for conflicts with, when we load the tidyverse, with existing loaded packages. And in this case, I'm loading the tidyverse before loading any other things. So this is the conflicts with base R, basically, or the stats package in this case. Filter and lag are functions that exist there that tidyverse is overwriting or dplyr.
If the conflict resolution with base R looks something like this, it just gives precedence to the most recently loaded package. So if I have not loaded the tidyverse yet, and I try to do something like filter for the species where the penguins are Adélie, it will give me an error that's not like I can't find the filter function. In fact, it's giving me the error of what would this sort of expression passed onto stats filter would look like. After loading the tidyverse, base R will silently use the last loaded package, and things work nicely. Until they don't, I suppose.
With conflicted, what you can see is that if that package is loaded, the error is a little bit different. It is saying that I am not going to just use one of the ones. It's saying there are two packages that have the filter function, and you need to explicitly choose. And you can explicitly choose with sort of a method that doesn't require conflicted at all by saying which package name and then colon colon the function, or you can say I'm going to use filter a lot. I know that I want the dplyr filter going forward, so for this session, I want to prefer dplyr filter. So from that point onwards in my session, it is going to use the dplyr filter.
So this is making things a lot more explicit, which, when things are going fine, is almost overhead, frankly. But when they're not, it's actually one of the more annoying, I think, error messages to sort of figure out when you're using the wrong function from a package you didn't intend to. And this can grow to be an even bigger problem when you have lots of packages that might have sort of named conflicts.
So a little bit of teaching tip around this. I said that loading the tidyverse message got even longer now, and I did hear the sigh, and I am with you on that. But I think that it is important to show these startup messages in the teaching materials and not hide them, especially if you teach with slides. I know that it is so tempting to hide them because they take up so much space, but I think it's important to address them early on because, first of all, you want to model good behavior. You can't ask your students to read error messages if you don't read them yourself, or any messages for that matter. So it requires, it encourages reading and understanding messages, warnings, and errors, and what the distinction between them are. And also it helps during hard to debug situations that result from base R's silent conflict resolution.
dplyr updates: joins
All right, so let's talk about dplyr, which got a lot of updates over the last year. Many, many updates that sort of expanded its functionality. So I am going to talk about a few things that cross my path on almost a daily basis. This is a non-exhaustive list, so at the end I will point you to other places where you can read about other advances in dplyr.
One of them is improved and expanded join functionality. One of them is added functionality for per operation grouping. And the other one is some quality of life improvements to case when and if else. Case when happens to be my favorite function if I had to pick one, so that's why I'm highlighting it.
And there are a few more. So let's start with the joins. There is a new join by function that we can use for the by argument in any of the join functions. And the new join functions have all gained new arguments that allow us to handle various matches like one-to-one, one-to-many, many-to-many relationships, as well as explicitly handling unmatched cases.
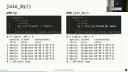
So let's start with join by. Previously, maybe you did something like this and even, I don't know, somehow seems crazier to me that you could actually get away with not putting these quotes here as well, because that's how you would define a named vector in R. Now, optionally, you can do this. So this is optional, but I do think it is a quality of life improvement where we're passing a join by function and then we can actually use sort of the non-standard evaluation to not have to quote our variable names.
So what does that look like? I'm going to make up a data set. This is real data, but not necessarily the most useful data. Here are the coordinates for the three islands that appear in our penguins data set, and what we're going to do is we are going to join these to our data. With by alone, you could do something like this, where, and just to remind, the data frame name is islands and the name of the island is in a column called name. So we can say, take the penguins data frame and then left joined it such that the island in the penguins data frame matches name in the islands data frame. Or you can do something like this, where you can actually articulate things as, take the penguins data frame, left join it to the islands data frame, where island is equal to name and the two. So we actually can use these sort of logical operation that we use elsewhere in R as well.
So my recommendation from a teaching perspective would be to use join by, particularly because you can read it aloud, read it out loud as where x is equal to y, which is something you probably already say if you do tend to read your code out loud, wherever you have the double equal sign. And also you don't have to worry about the various ways of sort of passing name vectors, where you can't have both of them uncoded here. This would be invalid, but either this or this would be valid. And personally for me, I find, you know, being able to teach joins early on to be a win. Being able to talk about name vectors early on to be not as big a win. Not that they're not important, but something that can come a little bit later perhaps. So it helps you avoid some awkward conversations, I would say.
Now let's talk a little bit about handling various matches. So previously join functions looked something like this. A few more arguments, but mostly two data frames that you're joining and a by argument. And now they have a few new arguments as well, with extensive documentation around them. But I want to just highlight a few cases that might cross your path, and that might come in handy.
As a setup, we're going to create three data frames. One of them is a data frame of just three penguins. These are just three randomly selected penguins from our data frame, and we know their species and the island name. Another data frame is something hopefully realistic, where if you are measuring anything in a scientific setting, chances are you are measuring things multiple times and multiple times and averaging them or something like that. So this data frame indicates that for those three penguins, we have their sample IDs and also a measurement ID, where instead of weighing the penguin once, we weighed each penguin twice. So we have a measurement ID of one and two for both. And the same thing for their flipper length as well. So we have these three data frames. You can perhaps imagine a situation where different people have collected these data.
Now, one-to-many relationships, things work out pretty nicely. I have my three penguins data frame that, remember, had three rows, a row per penguin, and I've joined it to the weight measurements data frame, and everything looks fine. It's basically my measurements joined with the species and island of those penguins. Not much to think about here.
Now, with many-to-many relationships, on the other hand, we get a warning. So here, I am taking my weight measurements data frame, maybe from one of the scientists, and the flipper measurements data frame from the other, and I just say, just bring them together by sample ID, and I get a warning saying that row one of your first data frame matches multiple rows in your second data frame, and row one of your second data frame matches multiple rows in your second one, and so on. It says, if you want to silence this, tell me that you are, in fact, intending to do a many-to-many match.
So, we can go ahead and do that. We can go ahead and say, I do want to make a many-to-many match. Does this look correct? What do we have here? We had one scientist take two measurements each on three penguins, so six measurements, and another scientist take two measurements each on the same three penguins, so another six measurements, and somehow what happened is I ended up with a 12-row data frame. So, I have an explosion of rows, which doesn't seem so bad when your options are six versus 12, but you can imagine a scenario where this could be problematic if you had a large data, two large data sets that you're joining.
What actually is happening is that we probably should have joined by both sample ID and measurement ID, right? So, instead of joining by a single variable, the penguin, or the sample ID, we probably should have joined by both so that we ultimately have six rows in our data frame with measurements coming from the two scientists. So, the takeaway message here is that, one, the many-to-many relationships can be costly, particularly computationally, so the warnings are helpful to stop you and make you think, but the warnings themselves aren't enough to get you to the right answer necessarily.
So, the takeaway message here is that, one, the many-to-many relationships can be costly, particularly computationally, so the warnings are helpful to stop you and make you think, but the warnings themselves aren't enough to get you to the right answer necessarily.
Now, let's do one more thing. I'm going to bring in one more penguin, so that we have three penguins. I'm adding in one more, an Adelie penguin from the Biscoe Island, and now let's join the four penguins data set to our weight measurements data set. Remember, three penguins were measured so far, and what I've done is I've said, I'm going to take the weight measurements from one of my scientists, and I'm going to join it with my four penguins data set to get the information on the penguins, and what happened to the fourth penguin? Poof, it's gone.
And that's potentially what we intended to do. I mean, I explicitly selected left join here, right? I am saying, keep all the rows in the left data frame, and don't worry about the rows in the right data frame. Maybe that is true, but if you have a large data frame where you can't really see all of the rows, where it's not so obvious what disappeared or did not disappear, that can be a pretty risky move. So one thing you can do with a new argument unmatched is say, if anything is going to go poof, just give me an error first. So let me, stop me in my tracks before I continue.
And I think that this sort of introduces a paradigm of programming where you're not just like writing things and then just like expecting a whole document to render because you wrote the code correctly. It actually is making you to explicitly use sort of the code that you're writing to check if what you're doing is indeed what you're intending to do. So in this case, it says if there are any unmatched cases that are going to go poof, just error out, and let me think about it. And it did say that row four of y, that fourth penguin was not matched.
So now I, as the analyst, have two options. I can say, maybe I just want to do an inner join where I wanted to make sure that basically the matching penguins are the only ones that I want. Or I could say that if there are any unmatched ones, just drop them, which is the exact same result I had at the very beginning. The difference being that I am intentionally sort of doing this and nothing is just sort of disappearing under my, like without me realizing.
Or you can just do nothing. You can just go with the default. So the defaults work just as you would expect, but they don't necessarily allow you to catch yourself making errors, and chances are you're working with more than three penguins at a time, and it is a lot easier to sort of introduce these errors, particularly if you write in pipelines.
And there are a bit more on joins as well. So we talked about join by, we talked about different ways of handling relationships and unmatched cases. There are two other exciting developments that are inequality joins and rolling joins that are basically all made possible because now instead of saying, take this one variable from the first data frame and this variable from the data frame, I actually into the join by function can pass on expressions that say something like less than or greater than or whatnot. If you want to read more about these, I have included some resources here, and I'll share the link to the slides at the end as well.
And if you're thinking, what in the world are inequality joins and rolling joins? If you know, you know, okay, that is the reality. And I personally, for me, they don't cross my path as often as some of the other things do. But I also don't tend to work a lot with sort of time series-ish data sets, I think where these come into play a bit more.
That being said, we do have a new section in the second edition of R for Data Science that is dedicated to the various types of joins that you can do. And these are also moves that you can easily do with data table package and in SQL as well. So basically these sort of expanded functionality in dplyr is sort of matching other tools that you could use in order to achieve the same outcome.
All right, and in terms of a teaching tip, I would say that the exploding joins, particularly where we just ended up with like extra rows where we didn't intend, can be hard to debug for students. Because I think joins are like inherently, in my experience, relatively straightforward to teach and relatively straightforward to learn. But diagnosing when, you know, cases sort of disappear, or when they gain an unexpected amount of cases, or performing a join without thinking and taking down an entire teaching server, which tends to happen whenever we do sort of open-ended projects with our students, these things do happen. So I think that teaching some of these sort of defensive strategies of coding is using them for your own use is good. And I think teaching them can be helpful as well, particularly if you're expecting that students will be working with data that might be unfamiliar to them, where they may not have the intuition to be like, wait, why did I just all of a sudden get 12 rows here like we were able to do so earlier?
dplyr updates: per-operation grouping
Another exciting functionality in dplyr, a new functionality, is per-operation grouping. So previously, grouped summaries, for example, looked something like this. You take a data frame, you group by a variable, and then you can maybe calculate a summary statistic. Now, optionally, you can do this a slightly different way, where you say summarize, and instead of group by happening in a previous step, it is actually happening in summarize. And again, this is optional, group by is not going anywhere, but it is something you might consider.
Let's take a look at this. Remember this typical tidyverse pipeline I showed earlier, and we actually did set dot groups equals drop here. So let's think about why did we do that. If I don't do that, I end up with this message. To summarize has grouped by output by species, and you can override this using the dot groups argument. So what? What happened is I had grouped by species and sex, and then when I ran the summarize function after that, it almost peels away one layer of grouping and leaves the data frame grouped behind it.
But frankly, it doesn't matter. I get the same ggplot at the end. I don't really care that it was grouped to begin with. Turns out in this particular setting, I don't care. What if I was doing something else? What if, for example, I was saying I want to group by these two variables, I want to calculate the mean body mass, and then finally, I want to get the top row. So I'm going to say slice head and give me the top row. These are two different outcomes, and in one of them, I am not doing anything to address the grouping over here, and here I am dropping the groups.
Another example of this is one of my favorite packages, I would say, when I'm doing reporting, is the GT package, and it has a really nice functionality that if you feed in group data frames to it, it will give you a table that sort of has these like, as you can see, these rows that are sort of subheaders, I guess, per group, which is neat, but might be unexpected if that is not what you were intending to do, if you did not intend for your data frame to be grouped going into it.
So this is what the output would look like if my data frame wasn't grouped. The exact same output, right, the numbers are exactly the same, it's just how GT is handling a group data frame versus a non-group data frame.
So how do we handle groups? One option is what we did before. I can say, yeah, I want to drop the groups once you summarize, and give me the mean body weights per species and sex, just drop them, I don't need them anymore. Or I can say explicitly, keep them, where I actually keep my data frame grouped by both of the variables, in case I want to actually continue sort of using a group data frame for further operations. And there are a couple other options as well, like keep last and stuff like that.
Alternatively, what you can say is, I don't want persistent groups. When I want to group things, I just want to do them in the summarize function that I'm using, and then if I want things grouped again, I'll do it again. So in this case, what we're doing is, instead of group by, we're saying in summarize, I can say group by one of the variables, or group by multiple variables, where I can feed a vector into it, and get the same output. And you can see that same output in terms of the numbers, I mean, but you can see that none of these data frames are grouped ultimately. So we are basically doing per-operation grouping, as opposed to persistent grouping.
So what is, I mean, how do you choose between these two? I don't know, I think whichever you want is the important thing. I think the important, the reason why the by functionality has been added is because this, as much as the output that we've been seeing signals there are groups here, it's very easy to miss that. Particularly easy to miss it if you tend to write really long pipelines. And it can introduce errors, again, down the pipeline that can be hard to debug, or unexpected results like that GT output that we were seeing. So group by is not superseded, and not going away, and if you have your own sort of methods for successfully dealing with the persistent grouping, then you should continue using that. But if this has been a problem that you sort of encounter yourself running it into, it might be worthwhile to try per-operation grouping.
I will say that some of the verbs take by instead of dot by, and I just, I don't know, it is what it is. There is a technical reason for it, I think it's a little unfortunate to be perfectly honest. But they come with informative errors when you do dot by instead of by, so at least it can sort of help you correct things. And in my heart I am hoping that that bullet point can go away sometime, but I'm not sure technically how feasible that is.
Important to note that dot by always returns an ungrouped data frame, so that's why we're calling it a per-operation grouping. And another important thing is that you can't just create variables on the fly like you could with group by. So with group by you could almost sort of skip a mutate step and create a variable that you want to group by. Frankly, I find code like this hard to read, and hard to debug, and hard to come back to, so I think that this is not a loss, but it's something to keep in mind.
And another thing is that dot by doesn't sort grouping keys, so I will actually switch over to the previous slide for a second to show what I mean by that. So over here we're using dot by, and you can see that our, the order of the species is Adderley, Jantu, and Chinstrap. So that's in the order in which they appear in the data frame, not alphabetical order. However, if we look at the output of group by, here we go, we can see that it's Adderley, Chinstrap, and Jantu, so they have been alphabetized. So the dot by argument won't do the alphabetization, so that might be another thing where you're thinking, I expected my results to be exactly the same, just how I approach grouping differently, and that's not 100% true.
All right, as a teaching tip, and I can't say this super authoritatively because I have not taught with dot by, so I almost want to say teaching idea instead of a tip, but I think the important thing would be to choose one grouping method and sort of stick to it throughout, particularly because the functionality is the same. Ultimately, especially for new learners, I would pick one and stick with it, and for more experienced learners, maybe particularly those who are like designing their own functions and packages, I think this tells a nice story of sort of evolution, and you can sort of go through the differences of each output like I have done here and think about, you know, how do we choose which way to approach the same problem.
dplyr updates: case_when and if_else
Here are two sort of contrived examples where I'm creating a new variable x in my data frame df, and I have three conditions, and I just happen to pick that the values are character strings. And previously, you would have to say here are a few conditions and all else if none of those conditions match, so that's why we said true, and if that needed to be an na for some reason, you would have to say that's not just na but a character type na. With recent improvements, we have sort of two new things that we can do. Instead of that true, you can actually just use a dot default argument, and you don't have to worry about matching the na type.
So what I'm going to do is first I've calculated two things, the 25th and 75th percentile of body mass. I've also introduced a new function here, reframe, which sort of does like a summarize-like move, but instead of just outputting one row per group, it's outputting multiple rows per group. So these are just these two magic numbers that I want to take a note of. I'm going to use these in a case when statement, my 25th and 75th percentiles. So with case when, I can do something like this. Even though what I'm creating this categorical variable that is character, I don't have to specify na character for the values that were nas, and for my last option instead of true, I can just give a dot default.
How big an improvement is this? I would say that if you perhaps have had to teach case when many times, you might think that is an improvement. If you're sort of writing case when arguments yourself and you're a pretty experienced R user, I'm not sure how big an improvement that is. I do think that the na type, at least for me, I don't often think about, oh, I need to match my na type when I write these statements, and I often will be sort of stopped in my tracks with an error message and then have to fix things. So I think that is a big quality of life improvement.
And that similarly works with if else as well. So here I'm creating a new variable that basically sort of adds a unit to my body mass, and you can see that the first sort of the condition for true is a character string, and I can again get away with just saying if the value is na, just make it na as opposed to na character.
tidyr updates: separate functions
And a few more things. There are a few new functions that you might look into, like case match, which further simplifies your case when code, being able to select columns inside a mutate or summarize with a new function pick, and also some reproducibility and performance updates to arrange. These cross my path a little less regularly than the others, so I sort of left it at feel free to read about them.
And lastly, or actually second to last quickly, let's talk about tidy R. A few more updates in tidy R as well, but I want to highlight specifically one of them, which is a set of functions that supersede, and what I mean by supersede is we recommend you prefer them over them, though the older functions are not going away, called sort of separate functions. And you can sort of see in this table, we can separate with a delimiter, we can separate by position, or we can separate by regular expression. And we can separate to make columns where we go wider, or we can separate to make rows where we go longer, sort of like pivot wider and pivot longer.
So here's an example of someone who collected data and did so in a really annoying way, where they have, oh apologies, I really should, these IDs should have been 1, 2, 3, they're not going to harm anything in our example, but they should all say 1. But so we have three penguins, and we have some description column about them. So what we might want to do is we might want to split this into multiple columns. So I could do something like just split it into two columns, so separate, wider, delim. This basically is what separate looked like previously as well, frankly.
But we can see lots of sort of like added text here, right? The word species being repeated, or the word island being repeated is entirely unnecessary. And you could stop here and say, I know how to remove certain text strings. I'll do that with a mutate, and I'll be done. And if that's you, that's great. If this is you, first of all, kudos to you. It's not always me. But if you like writing regular expressions, like as a thrill, you can do that. And you can say, I want to separate now with a regular expression.
And if you tend to work with data where a column tends to incorporate information about a lot of things, this tends to be, so the example in the documentation for this is, for example, about some census data from the U.S., where they'll have a column of a numeric string. And actually, if you parse it, it tells you something about the census block and the address, the state, so on and so forth. So if you tend to work with data like that, this can be incredibly useful. And you can see that instead of a delimiter, we basically have a pattern we're specifying. And we're saying that the first thing you see will be species. And then, you know, grab the next word after that until the comma. And then there's going to be a comma. And then the next thing you see will be an island and a dash after it. And then grab everything else after that. And it basically will put it in place.
And chances are, if you're having to do this, chances are these are a little bit more complex than what I have here. As I said, I just don't find it all that thrilling myself to write regular expressions. So I gave a simpler example here to illustrate the concept. But the idea is that it gives you a lot more power to genuinely separate these things.
And then there's enhanced reporting when things fail. So this is what the separate function looked like previously. It had things like, what if I had extra things? What should I do with them? Or what if I didn't have enough things? How should I fill in the boxes? And now, you actually have, again, similar to that the unmatched cases example that I gave, an option you can use that you would never want in your final code, but can be incredibly helpful when you're actually developing code, which is an option of debug. So you can say, I want to just show me what is going wrong where, instead of just telling me in which row and making me scroll through my data frame to try to find.
And once you sort of run your code in that debug mode and you can see a summary of what might be going wrong, you can then decide, OK, if I have too few pieces, should I align them at the beginning or should I align them at the end? If I have too many pieces, should I drop them or should I merge them? So some of the functionality is similar to what we had before, but this idea of erroring out or debugging help you with a little bit more defensive coding.
And as a teaching tip, I would say that particularly if we tend to teach folks who come from spreadsheet background, and I am one of those, I first learned how to do data analysis in Excel as an actuary, then I learned R. And, you know, if you work with folks who do text to columns in Excel, they know very well that there are many ways of splitting that text into columns. This is true for like Google Sheets users as well. So even though it looks like new functionality and like extra functionality, this is actually something that folks encounter in other avenues as well. And this is just sort of like putting a name to it in R.
ggplot2 and other updates
All right, one quick thing with ggplot2, where if you use, if you have lines and you set the size to make them thicker, now it will give you this sort of warning and say you should use line width instead. And I did this, I wanted to show this to you, just to end things on a light note, just check your teaching materials thoroughly to not make a fool of yourself when teaching, because I feel like I just went through an entire academic year of standing in front of my slides with a warning saying use line width instead.
All right, a few other things. There is better string R and tidy R alignment. There's an ability now to distinguish between NA in levels and NA in values and forecasts. There is new and more straightforward to learn and teach API for the Rvest package for web scraping, and shorter, more readable, and in some cases, faster SQL queries in dbplyr if you tend to go between databases and R often.
And a few more. And if you want to keep up with these, if you actually want to keep up with them at real time, the tidyverse blog is a good place to read with each package sort of update or upcoming updates where we ask for feedback. This is where we post things. And there's also, it's a good place to learn about other tidyverse adjacent development, which is things like tidy model or web R. And if you haven't heard about what that is, I do recommend reading that blog post. I won't ruin it for you.
If you're looking for a more comprehensive overview of everything that's like current to date with data R for data science, second edition, I literally turned in the last edits on my flight here today. So I think it should be going to print soon. And thank you so much. The slides are here on the top link. And the code that I've gone through is in this GitHub repository. If there are questions, I'm happy to answer.
Q&A
Hi. Hi. In your discussion about joins, I noticed you didn't mention anything about keys. A lot of problems that I've seen in working with databases is the lack of a unique key. And so quite often you get this exploding data, which you talked about, but also missing data and this sort of stuff. Is there any reason why you haven't talked about keys?
So I haven't used the word key specifically. That's right. But those basically would be what you are passing into the by function or the by argument or the join by function. Yeah. And I guess in the case of the exploding rows that we saw, that was sort of like being sort of not careful about what makes a distinct key. But I guess in this case, if I'm understanding the question correctly, you don't need to have a single column that is a unique key identifying things. You can simply pass multiple variables that make up a unique key.
Yeah. I guess it comes from a diagnosis perspective that I checked over SAS code quite a lot. And one of the big problems was the lack of unique key. And so they used to drop the duplicate variables values, which was terrible. Yeah. Lost a lot of data. And of course, when somebody came back and there was a sort involved, different results. And it's all because I didn't have a unique key. And I think it's quite important as a concept to think, OK, I've got a problem with my data set. Is it because I'm not identifying how to link the data sets? Yeah. Anyway, that's right. Yeah. And the relationship argument that I mentioned, where I've given an example of a many to many relationship, it will take other options like one to many or many to one that I think would help address some of that as well.
Yes, I had a question about the separate sort of functions. You had this nice table that was like a two by three layout. And there was one that was missing that was separate longer regex. Yeah. I'm wondering, and I realize that didn't exist previously either. Is there any reason why you can't do that? Because I've actually had a couple of occasions where I've wanted to.
So it doesn't currently exist. I am not 100 percent sure of a technical reason why. I think one of the things is that we haven't come up ourselves with examples where that was useful. But I would say that will be the sort of thing where especially if you have a use case for it to chime in on the issues for a tidy R. Yeah. Yeah. I mean, it's pretty niche and obscure and with horrifying data to work with. But, you know, I think that niche and obscure is equally valid, isn't it? I think that I think actually being able to find real examples of those is so helpful for thinking through sort of enhancements as such. If you think about it, the separate function was a very naive approach to a real problem, but it didn't address any of these like things that might feel niche and obscure. But then when you think about it and look at the issues like there are at least 100 people struggling with the same thing.
So we have a question from Slack as well. So the question is about the group by enhancement, whether there's been some kind of a performance enhancement behind it as well. There is their performance enhancement. I am unable to answer that question authoritatively. So I do not know. I do know that it is not slower, but I don't I believe the original sort of motivation for it wasn't performance. It was the issue that we talked about this like group sort of lingering around silently was the original motivation. And the dot by argument should not have did not make things slower, but has it made things faster? I'm not sure. I do know that there were comments about performance in the blog posts, though. So that will be a place to look. But I don't know off the top of my head.
So I actually have a question as well. So you did so many new kind of functions as well as arguments you're introducing, which I like some of them like case match, join inequality, join. I'm actually wondering the process that happens behind the scenes of how you decide like what is going to be like available function, what's going to be available argument. I wonder if you can share a bit of the process.
Yeah. So there are a few ways that this happens. Sometimes it is a sort of a minor fix and one person in the team implements it and another reviews it because like there was an issue open and a few thumbs up and a few people chiming in saying yes, this would be good. But for example, for something like this and also this enhancement for the separate functions went hand in hand with one that I didn't get into detail, which was the alignment of functions in string R and tidy R that deal basically with character strings. Because if you think about this whole separate thing is about splitting character strings oftentimes.
There is a process that is sort of inspired by Python's, I believe peps, where you sort of like propose an enhancement or a change or an update and then you do a write-up. So someone from the tidyverse teams does a write-up. The repo is called tidyups, so it's under the tidyverse organization. And so some ideas develop there and we actually, we have weekly meetings where someone will present on it and especially for something like this, I'm making up a number, but I wouldn't be surprised if this was like three or four separate like presentations where we discuss what is the right syntax, what's the right API for it, what edge cases we're missing or not missing. And then, you know, there's a proposal that's written that a couple people on the team will be like, okay, I'm sort of a signatory to this proposal. I can see how this is valuable.
And then for big updates like this one and also many of the dplyr updates, one of the team members will often write a blog post sort of soliciting feedback from the community. So while the package is still in development, sort of soliciting feedback and then if sort of like that feedback is feeling like, okay, there's enough, like people can sort of see how this would improve their workflows, ultimately things get merged in. And then sometimes things get merged in that really like piss people off because like they give a message or something. And it's really a balancing game of how many people's like maybe niche problems that have we been able to solve because they work with this like, you know, incredibly useful but awfully formatted government data set versus a few people need to read messages. So it's really a balancing game and I don't think the goal isn't necessarily to make every single user happy necessarily, but I think two goals are sort of making things so that we don't lose functionality and also making things so that functionality is consistent across packages.
Because as you can imagine, as the number of people who work on the packages and the functionality of the packages grow, sometimes things diverge and it's useful to sort of take a pause and take a look at, okay, we have these characteristic things happening in two packages. Like how do we make sure this is not super confusing to users? And so issues from people who do data science, like who actually do analysis are really helpful. And I will say that hearing from educators who actually have to articulate this and teach it to new learners who ask the most critical questions of why did you say that the other day and you're saying this today are also incredibly helpful for finding those misalignment cases.
And I will say that hearing from educators who actually have to articulate this and teach it to new learners who ask the most critical questions of why did you say that the other day and you're saying this today are also incredibly helpful for finding those misalignment cases.
Okay, well thank you very much for sharing that. Yeah, you're welcome.
You know, let me try to think if there's like something I know for sure. That's a really good question and I don't have a good answer for it off the top of my head. And I think it's because over the last couple months I've been so like in the mindset of catching up with what's there in terms of the book that I haven't done a whole lot of a look ahead. I don't think we have a big tidy up like this that's sitting there. I do know that there's quite a bit of work in terms of sort of performance enhancements that happen with dplyr particularly. And I will admit that I tend to be like I think they're like super crucial but they don't like I personally don't get affected by them a lot. And so I tend to be a little bit behind the curve when it comes to performance stuff. So I don't have a great answer for it.
So question from online. So there's a theme set function in ggplot to overwrite the default. Would something similar for dplyr be a good idea? Set default grouping behavior.
Good question. So I am a big fan of that theme set function particularly for things like writing a report or doing a presentation where I can just set that at the beginning and I don't have to keep adding sort of theme arguments. I can see how setting some of these as an option can be useful. I can also see how that can if it's not as explicit as theme set where you do it sort of like there's things where you can do theme set versus there's options that you can set. And generally I would think that the options is not the way to go because they tend to be sort of not so transferable between folks like for reproducibility purposes. Off the top of my head I don't see why that wouldn't be a good idea. So I would say that would be a good issue to open to see if there is like sort of traction or if others can think of sort of reasons not to.
So another question online is are there any plans to introduce tidyverse paradigm to Python since RStudio is now called Posit?
So I can say that on the tidyverse team there is Michael who works on Shuba which is sort of a dplyr port to Python. There's also Hassan who works on Plot9 which is like a ggplot2 port to Python. So in terms of supporting open source work that sort of take this design philosophy and implement it in Python the company has made an investment in it and actually just like personally I can say they're hearing from them in terms of their development process and how things sort of similar conversations happen in Python land has been super informative for me and I think has made the team better. I don't think
