
Keynote: Hadley Wickham - Embracing multi-lingual data science | PyData Global 2022
www.pydata.org RStudio recently changed its name to Posit to reflect the fact that we're already a company that does more than just R. Come along to this talk to hear a few of the reasons that we love R, and to learn about some of the open source tools we're working on for python. PyData is an educational program of NumFOCUS, a 501(c)3 non-profit organization in the United States. PyData provides a forum for the international community of users and developers of data analysis tools to share ideas and learn from each other. The global PyData network promotes discussion of best practices, new approaches, and emerging technologies for data management, processing, analytics, and visualization. PyData communities approach data science using many languages, including (but not limited to) Python, Julia, and R. PyData conferences aim to be accessible and community-driven, with novice to advanced level presentations. PyData tutorials and talks bring attendees the latest project features along with cutting-edge use cases. 00:00 Welcome! 00:10 Help us add time stamps or captions to this video! See the description for details. Want to help add timestamps to our YouTube videos to help with discoverability? Find out more here: https://github.com/numfocus/YouTubeVideoTimestamps

image: thumbnail.jpg
Transcript#
This transcript was generated automatically and may contain errors.
Good morning from New Zealand, where I'm currently staying for a couple of weeks. But wherever you are in the world, welcome.
So as Lachan said, I wanted to talk a little bit about multi-lingual data science. Hopefully I don't need to belabor too much why this is important, because I think it's pretty obvious that every team has to deal with multiple languages, because regardless of whether you use R or Python or Julia, you have to use SQL as well. There's no getting away from it. We kind of strongly believe that there's no way to... It would be awesome if we could all just standardize on one single language, but that's never going to happen. So rather than fretting about it, rather than worrying about it, rather than letting it stress us out, let's embrace it.
Let's embrace the different strengths and weaknesses of various languages and really think about how can we help teams of folks using different tools work together as effectively as possible. So today I kind of wanted to talk about three things. The first, as Logan said, is to share a little bit of my love for R. R is like a weird language. It's definitely got some quirks, things that don't make sense, but it also has a few things that seem surprising when you first hit them, if you've used a language like Python particularly. You're going to see these things and think, wow, that is really, really weird. And I want to talk a lot about some of that weirdness and why it's not wrong, it's just different. And in fact, it leads to some pretty cool and surprising features.
Then I want to talk a little bit about the sort of journey from RStudio to Posit, like why do we change our names, what's kind of our mission as a company, and then dive into some of the tools that we are really working on currently that are, again, not about that idea of how do we help multilingual teams work together as effectively as possible.
Three surprising features of R
So I'm going to start with three surprising features of R. And these things are surprising because when you hit them at first, they might not seem like features. They might seem like bugs. And they're certainly going to feel very weird coming from just about any other programming language. So I want to kind of highlight some of those, talk about why they're actually cool and interesting, and show you a little bit of R code along the way.
So for context, the job of me and my team primarily is to develop the tidyverse, which is a collection of R packages that make data science fast, fluent, and fun. But we also develop tools that software engineers use, tools for package development in R, things like Roxygen 2 for inline documentation, test that for unit testing, package down for beautiful packages, and use this for automating every part of the package development process that you possibly can. So all up, we spend a lot of our time kind of thinking about user interfaces, thinking about how we can make data analysis as pleasant, as enjoyable, as fluent as possible for data scientists. And similarly, how can we do the same thing for kind of when you switch hats from your data scientist hat to your software engineering hat, how can we help you make robust, reliable packages as easily and painlessly as possible?
So I'm going to show you a little R code shortly, and I'm going to motivate that code. What I'm going to do is make a scatterplot. So this scatterplot is on the x-axis. You can see we've got distance, and on the y-axis, we've got speed, and then we've got a bunch of dots. And each of these dots represents a route of a flight in the continental US. So in origin and destination, we've got some data about those flights, which I'll show you shortly. What we've done is aggregated each route to look at the distance and the average speed, and we see this interesting pattern, which I'll talk a little bit about later.
But what I want to talk about first is how do we get to this plot? So we're going to start with some data. So we've got about 300,000 rows of flight data, not a particularly large data set, but nothing either. We've got information about when the flight departed, both when it's scheduled to depart and when it actually departed, when it arrived, who flew it, which airline, what the flight number was, what the plane tail number was, etc. The time it spent in the air, the distance, and so on. If you look carefully, you'll notice there's no variable here for speed. We've got the time and the distance, but we don't have the speed. So our first task is going to be to compute that.
And to do that, we're going to use a function from the dplyr package called mutate. The job of mutate is to create new variables, and so we're going to say we want to create a new variable called speed, and we're going to compute that variable. That's just the speed, it's just the distance in miles divided by the time in hours to give us miles per hour. Now here, airtime is a minute, so we just have to do a little conversion there. So this should mostly look straightforward.
There's a bit of weird syntax here. This thing is called the pipe, and it's the easiest to pronounce then. I'll come back to the pipe a couple of times in this talk because it's a really important and interesting idea, but for now, just in your head when you see this, read this as then. So we take the flight's data, then we mutate it to add a variable called speed, which is this function of distance and airtime.
So the next thing we want to do is we want to summarize each route, and a route is a combination of origin and destination. So the first thing we know is we're going to declare that, like this is our unit of analysis. We're going to say we want to group by the origin and destination, and then we want to summarize it to compute these three variables. We're going to compute the distance, the speed, and then just count the number of flights. Now you might kind of wonder when you're like thinking about this in your head, you've got a flight route between two airports, shouldn't the distance always be the same? Hopefully, yes. Like obviously the speed's going to change because sometimes planes take longer, but hopefully that distance should always be the same. Here I'm just using mean as an easy way to like get that. If you're doing a real analysis here, you might also want to compute like the standard deviation of distance, because if that's not zero, that's telling you something pretty weird about what's going on with these airports.
So we've got the distance, we compute the average distance, the average speed, removing any missing values, and then we also count the number of observations. And this is good because you know whenever you're doing an aggregate, you want to know the number of observations you're aggregating over, because you know there's hardly any observations. There's going to be a lot of variability there, and they're probably not that interesting to look at. And so in fact that's the next thing I'm going to do, is I'm going to say just give me the rows, give me the route that have at least 10 flights, 10 observations.
So now we've added that variable, we've grouped it, we've summarized it, filtered it, now we want to turn it into a plot. So we're going to switch from the dplyr package to the ggplot2 package, and the key idea of ggplot2 is that a visualization is just a mapping between variables in your data, the things that you can perceive, which in ggplot2 we call aesthetics, and we use AES for short. So here we're saying we want to create a plot that is going to map the x position on the plots to distance, the y position to speed, and then we're going to visualize each observation with a point, giving us a scatterplot. So ggplot2, it's a little bit different to other plotting systems that uses this idea called the grammar of graphics. It doesn't give you this canned set of named graphics like scatterplot, lineplot, pie chart, etc. It gives you these primitives, you map your variables to things that you can perceive, you pick the geom or geometric object you want to display them with, and then ggplot2 does the rest.
And so that gives us this plot. You can see there's like a pretty sort of pronounced curve here. Short flights, their speed is basically dominated by takeoff and landing, which are much slower, and the longer a flight is, the more time it can spend as kind of optimal, both the more time it can spend at like the optimal cruising speed, and the more likely the airline is to use a bigger, faster flight to travel.
There's one group of weird points which kind of don't follow this pattern. I looked at these just a little bit. These are a bit weird because these are the airports that are not in the continental United States, which is a little bit surprising because that's what was supposed to be the only thing in this data set. So again, real data analysis, you want to drill into that a little bit more, but you know, very, very common part of the process. You create a plot and you see something weird and it represents some data quality problem that you're going to want to cycle back to and figure out what's up.
First-class abstract syntax trees and environments
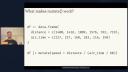
Okay, so that, just very, very quickly, here's a little bit of R code that does something, you know, small but realistic in a data analysis. What makes this tick? So the first thing I want to talk about, or to dive into a little bit detail, is just that that mutate function. And to do that, I'm going to create a data frame that just contains those two variables we care about, distance and airtime, and just the first six observations. Now, if you've never seen R code before, two kind of tricks. First, this arrow thing, this less than dash is R's primary assignment operator, that's what you use to create variables.
And then, this dot does not represent calling a method, it's just a regular symbol and a function. So if you're coming from Python or many other languages like Java, it's going to take you a while to get your head around this. You're not calling the frame a method of the data object, you're calling this data dot frame function. And that's the function in R we use to create data frames, which is the data structure used to store rectangular data. And then, just going to recapitulate the code we saw before, I'm going to take that data frame, then I'm going to mutate it, computing the speed. And the pipe here is just syntactic sugar. All the pipe does, it takes the thing on the left-hand side and puts it into the first argument of the function on the right-hand side of the pipe.
The next thing that's kind of interesting about this code is inside this function, we refer to distance and airtime just like the regular variables that you've just defined with assignment. But they're not regular variables. They're variables that exist inside this data frame. And you'll see this pattern a lot in R that many, many functions allow you to write code that works kind of inside a data frame as if you'd assigned the individual columns, the individual variables of a data frame, the top-level variables in your program.
And kind of even crazier, you can actually mix both variables inside the data frame and variables outside the data frame. Now, this absolutely can lead to really confusing and hard to read code. But most of the time, it allows you to really elegantly describe what you're doing to the variables in your data set without having to have a bunch of additional syntax to say, oh, this variable's inside that data frame, this variable's inside that data frame.
So why does this work? And this is kind of the first surprising feature of R. And that is it has first-class abstract syntax trees and first-class environments. So what does that mean? So every programming language has abstract syntax trees and has environments. Every programming language has some way to represent the structure of code, typically in some kind of tree form after you've fully passed it out and dealt with all the operator precedence issues, and some way to associate names with values, which is what in R we call environments.
Now, some languages, a few languages have first-class abstract syntax trees. This is kind of the famous thing about lists, right, that you can actually program on code. You can program code because there's a representation, a programmable representation of code. So R has that, and additionally, it has first-class environments. You can actually look at the way that names are bound to values, introspect on that, and modify that. And as far as I know, that is unique in the spectrum of all programming languages.
And as far as I know, that is unique in the spectrum of all programming languages.
And this definitely makes R code harder to optimize, but it also gives R this unparalleled ability to create domain-specific languages for solving problems, and we can apply that so well to data science. That's what gives us the tools like dplyr and ggplot2 that allow us to kind of turn our data science thoughts, our data science words, into code in a way that's generally pretty natural.
And it's also what gives us the ability to create tools like dbplyr. So dbplyr is a dplyr backend. A backend for dplyr is just, you have the same syntax, but it's the computation in some other way. So when you're using dplyr, you're going to connect to a database as the db might suggest to you, and you're going to write dplyr code just like you normally do, and dbplyr is going to convert that to SQL. So in this case, it's going to generate this SQL with a CTE that does, that computes the speed variable, and then a group summary. This isn't exactly, you know, the SQL you might write by hand in particular. We've kind of very conservatively quoted every single possible variable name just to make sure it's not a special name inside the data frame, and you might do a few things different. You might give those various informative names, but overall, like dbplyr does a pretty good job.
And it does this in a pretty, like the implementation of dbplyr is still pretty crazy to me because it does this by defining a special environment where like mean instead of like calculating the mean actually generates some SQL text that then gets inlined into this query. It's pretty, this is one of the, my kind of personal favorite packages that I've worked with.
But lots, there are lots of other uses of this in R as well. Just two I wanted to highlight are the ompr package for mixed integer programming. Here you can define relationships between integer variables, define like objectives and constraints, and then allow ompr to go away and like solve that problem for you. Another package, Greta, designed for Bayesian statistics. It uses a syntax like really inspired by what you might've seen in a Bayesian statistics class. So here I'm just defining a very simple linear model, Bayesian linear model, where I'm defining a prior distribution for my intercept and slope, describing how the mean is a function of the intercept and the slope and the data, how I expect the distribution of the predictor to be a normal distribution with that mean I just computed and that standard deviation defined earlier, and I can go away with it.
And this ability to kind of tailor the way that R code looks to match other environments, other ways of, other notational systems, I think is really, really powerful and really, really cool. And again, R can do that because it has these first class abstract syntax trees, first class environments, gives you this incredible ability to create domain specific languages that solves some small part of the data science process.
Methods belong to functions, not classes
Next, I wanted to talk a little bit more about the pipe. Because if you look at this pipeline that I show you earlier and kind of squint your eyes a little bit, you might say, oh, well, couldn't we just write that using like method chaining with Python? Like very, very similar, right? Just basically changing that pipe for a dot at each point. But there's something that's profoundly different about that pipe. And that is at each point, each element of that pipeline can come from a different package.
And the thing that makes this work is kind of surprising and mind blowing. And when I first encountered R, it took me several years to really understand. And that is that in R, methods belong to functions, not classes. So I don't want to go into all the details of this, but if you kind of think about object-oriented systems, every object-oriented system has these functions that you call and classes that you use and the methods are sort of the intersection. You can think of it as sort of a 2D table. That you've got functions and you've got classes. And most programming languages kind of organize their OOP system like row-wise and R kind of organizes it column-wise.
And for a long time, this was pretty quirky. Like two languages used this, Common Lisp and R. But recently, another programming language has come along that also uses this style of programming language, and that's Julia. And I think it's one of the things that Julia folks really attribute to the ease of reusing code in Julia is this style of object-oriented programming. It just seems to fit particularly with kind of like scientific computing and data science so well.
So, the consequences of this are pretty profound. This ability component of that pipeline can come from a different package. It means that we don't need these really big kind of monolithic packages like Pandas, like Scikit-learn. That when you're assembling a pipeline, you can assemble pieces from all over the place, which means the life of software developers is much easier because they can develop these small reusable pieces in isolation without having to consider this giant other package.
Package development and CRAN
Okay, so we've talked about two weird things, about two surprising things about R. The first one, first-class abstract and vector use in environments, which allows you to create these domain-specific languages. For data science, we have the fact that methods belong to functions, not classes, which allows us to write pipelines that combine tools from many, many different places. And the last thing I want to talk about is kind of hard to describe, kind of crazy at first sight, and that's like when you install a package in R, generally like 99% of the time, you just install it into some like a global repository of packages on your computer. Because when you're working with R, most projects don't need a virtual environment, and most people using R can just share the same set of packages across all of their projects, and things by and large just work.
Now, obviously, if you really care about long-term reproducibility, you're going to have to do more than that. You are going to have to capture your exact version of your dependencies using some, you know, virtual env-like tool in R. One is called renv, developed by one of my colleagues, but there's plenty of other options as well.
And the reason this is the case is that package development in R is really highly centralized. And I think it's easy to think of centralization generally as kind of a bad thing, or at least that's kind of the way that the tech is currently trending, is we want to distribute things as much as possible. But there are some big advantages to centralization. And so I just want to kind of briefly compare like CRAN, the Comprehensive R Archive Network, which probably supplies like 99% of R packages installed in the wild, versus PyPI, which maybe does 80% of package, private packages installed in the wild. And the thing that's like fundamentally different about CRAN compared to PyPI, and pretty much every other modern kind of software distribution tool, is that it enforces package compatibility. So at any moment in time, every package in CRAN must work with all of the current version of all of its dependencies on CRAN.
And no lie, this is a huge amount of work. This makes life much, much harder for developers. If you're developing a Python package, you can easily set up a GitHub action that automatically deploys the PyPI whenever you do a release. Whenever you tag, you can completely 100% automate that process, and it just works. In R, the process is much harder. You've got to go through the system that's like, I don't know, 80% automated and 20% human audited. And if you make a breaking change to your package, it's your responsibility to communicate that to all of the people who use your package on CRAN. And that's a lot of work. But it comes with like this big payoff for users that, by and large, they can just grab a bunch of packages from CRAN, and they all work.
And I think this is maybe one of the reasons that CRAN is so much more than PyPI. Obviously, there are other reasons like the Python. Generally, the number of Python programmers is much, much bigger than the number of R programmers. But I think this is not easy to publish. It's not as easy to publish a package with R. And that leads to fewer packages, but they tend to be easier for people to work with.
The other kind of last interesting fact is that the definition of a package in R is really baked into the language itself. It's included in the standard library. It includes this tool called R command check, which runs a bunch of standardized checks and inspects the documentation and tests and stuff in various ways. And it's been there for day one, basically, of R. But very, very early on, really key part of the success of R has been the ability to distribute binaries that are built on the centralized CRAN repository. And people have been able to install these on Windows for years and years and years. I think that's one reason that the distribution of operating systems is quite different between R and Python. Because I think something like 80% of R users are on Windows. The other 20% roughly split between Mac and Linux.
From RStudio to Posit
So those are three things. R has top level, first class, abstract industries and environments. R methods belong to functions, not classes. And most users don't need a virtual environment, or many users don't need a virtual environment, because package development is highly simple. I think hopefully these are three things that as a Python user or as users of some other language, you're like, wow, that's odd. But hopefully I've also shown you that these have some pretty cool consequences as well. And so when you see them, I hope you think not just like, oh, this is weird and wrong, but like, oh, this is different and interesting.
Now I do like, I don't know, I spend like 90% of my life in R. I do like everything in R. I just did a secret Santa for my family where I programmed the whole thing in R and sent out the email automatically. But there's lots of other people who work for the same company that I do. And the goal of our company is not just to make cool R packages, but to really have a positive impact generally on data science and technical communication.
So I want to talk a little bit just briefly. I don't think people talking about the companies is that interesting in general. So I want to go through this pretty quickly, but it is important because I think this is a pretty big, pretty big change for us. And I wanted to talk about, I think our goals are like pretty cool and I'm really on board with them.
So you may have heard of RStudio before. We recently changed our name to Posit. Basically to reflect the fact that we already are a multilingual company. All of our pro products already support multiple languages. But it's obviously really, really hard to sell people on buying a product that supports Python and Julia and whatever comes along in the future when literally the first word in the company name is the name of a programming language.
That's why we changed that name. And so you've probably heard of some of the products that Posit makes. For example, the RStudio IDE, which is very, very popular in the R community. Tidyverse, which we just talked about. Shiny, which is a tool for making interactive web apps. And R Markdown, which is a tool for making static documents, mostly static documents. And all up, out of about 100 engineers at Posit, about 40 of them work full-time on open source software. And many others work part of their time as well. So Posit really is an open source, fundamentally an open source company.
And our mission at Posit is not to make a shit ton of money. Our mission is to develop this like long-term, durable, trustworthy instrument that can really help the advancement of science and data science. Our goal is to be around for a really long time so that we can tackle problems that potentially take decades to solve.
Our goal is to be around for a really long time so that we can tackle problems that potentially take decades to solve.
So how do we do that? Well, first of all, we're a PBC and a B Corp. What does that mean? Well, if you're going to like traditional C Corp or LLC, basically the fundamental responsibility encoded in the corporate charter is to maximize value for shareholders, to make as much money as possible for the people that own some part of your company. The idea of the B Corp is to recognize, firstly, that there are people who you might want to think about who don't own some of the company, and that maybe the best thing to do is not just to optimize the amount of money. And so the idea of the B Corp is to recognize that there are other communities like the broader open-source data science community that we really care about. And it's like that caring, that importance is fundamentally baked into our charter as a company.
The other component of this is like we want to remain independent, which means we're closely held, we're private, we're never going to IPO, we're never going to be acquired by someone. Our goal is to be independent, and we do that by being profitable. And we're profitable because we sell software. So kind of four main things we sell. Connect, which really helps kind of get the hands of, we get data science out of the hands of data scientists into like a decision, either the decision makers of your company through like reports and emails and apps, or to other parts of your organization through APIs. Workbench helps teams of data scientists work effectively together, particularly utilizing shared high-power computational infrastructure. Package Manager helps make sure all of your dependencies are in line with your corporate policy, and everyone's using the same version in the same place. And then, surprise, PositCloud helps you do those same things but in the cloud.
Open source tools for multilingual data science
So to finish up, I want to talk about a few of the open source tools that we're currently working on that are specifically designed to support multiple languages. And the first one I want to talk about is Quarto, which is a tool designed to help you publish stuff, to make documents. The key idea of Quarto is you're going to start with some document. Those two types of documents you might start with. You might start with something like a Jupyter Notebook, where you have text, where you have code, and you have the results of that code. Or you might start with something like an R Markdown, more like an R Markdown document, now a Quarto Markdown document that just has the text and the code, and you need to run that code. And that code can be in Python or R or Julia or, you know, pretty much anything. In both cases, we're going to end up with a Markdown document.
Markdown is a really great, we think, like, format because it's a text format. It's easily diffable. You can check it as a commit, you can share it with people, easy to write by hand if you need to. But even more importantly than that, Markdown gets you into the Pandoc ecosystem. And if you haven't heard of Pandoc before, it's this really amazing tool for doing document transformations, basically. And by building on top of Pandoc, that allows Quarto to produce things like Word documents and PowerPoint presentations and PDFs and HTML files. You can even publish, kind of fully roundtrip, to publish a notebook from the end of it, if your input is something else, or even in some cases it's useful to kind of roundtrip, because some of the tools I'll talk about shortly.
So Quarto, like, helps you turn your words and your code into some document that you can share with others. It also provides tools for when you've got, like, a bunch of documents and you want to convey some bigger story, whether that's through a website or a blog or a book.
Now, if you're an R user, this might look kind of familiar. And that's no surprise, because Quarto was very much inspired by our 10 years of experience with R Master, which really, I think, convinced us that this core idea of literate programming for data science is the right approach. That you want to be able to create reproducible documents that, when you, when the data changes, you can rerun your code, combine it with your pros, and get a new Word document or HTML page or PowerPoint slide. But in the time that since R Markdown was created, like, the number of languages used for data science has increased. It continues to increase.
And so while, like, R Markdown did support other languages, you could absolutely use Python inside of R Markdown today, you still have to have R installed. And that's not, like, super compelling, right? If you're a Python user and you want to create a nice document, you don't want to install R. So the goal of Quarto is it's ground up reimagining. We're going to make it fully multi-language, fully multi-engine. So regardless of what language you're doing your data science in, whether it's R or Python or Jupyter or something that doesn't even exist today, Quarto is going to support that. Quarto is going to be the engine that helps you combine your pros and your code and your results to create some beautiful documents to share with others.
And generally, one of the goals of Quarto is to help make it easier to write scientifically, to do scientific writing inside of Markdown. And some of you might have seen this kind of humorous depiction of the tools you might currently use to write scientific documents. So, you know, you can start with, you might use Word, which starts really simple, but rapidly gets very, very complex. As soon as you add in citations or complex figures, it gets really, really complicated, really, really quickly. You could, of course, use LaTeX, which starts hard and stays hard. Once you've got the ability to do a LaTeX document, you've mastered the art of Googling for LaTeX syntax, it doesn't get that much harder, but very, very hard and not accessible to most people. So Markdown is a great way to start, but if you're using Markdown for scientific writing, you kind of rapidly hit some limitations, like you're going to have to bring your own tooling for combining multiple files, you're going to have to figure out the new syntax for the various types of things you want to do in scientific writing.
And so the idea of Quarto, the aspiration for Quarto is to really start as easy as Word and only get a little bit harder over time. And Quarto does that by building a bunch of extensions on top of Pandoc, extensions for things like citations. So you can just copy and paste a DOI in and you automatically get a nicely formatted citation. Rich cross-references between longer documents, equations using LaTeX math, complex diagrams and multi-fixed panels, all of these things that you need when writing, creating scientific documents.
And the thing that's great about all of these things is they're built on top of this extension mechanism provided by Pandoc. And the neat thing about this is that this extension mechanism is written on top of the abstract syntax tree of the Markdown documents, written on top of the semantics of the document, not on the text format. So if you've ever tried to do some of these things, introduce new syntax by hand with regular expressions, it starts off like it's doable if you want to add one extension, maybe. If you want to add two, you start to hit all of these weird edge cases and it's very, very hard to get fully correct. So Pandoc provides this really cool extension mechanism. The downside of that extension mechanism is you're going to have to learn a little bit about Lua. It's a relatively rare programming language, but it's designed to be used in exactly this situation, embedded inside other tools. So if you've used any other programming language before, whether it's R or Python or something else, you're going to be able to pick up Lua very, very quickly.
And then on top of those Pandoc extensions, Quarto provides an extension mechanism that makes it really easy to document your extension, to publish your extension, to share your extension with other people. So once you've figured out how to do this, the whole community can build on top of it. So here are some examples of Quarto used today. Personally, I use it for pretty much everything I write, all the books I write are in Quarto. But in the Python ecosystem, you might be interested in these two projects that use it. Wes McKinney's Python for Data Analysis uses it, and the Practical Deep Learning course from Fast.ai uses it as well. And if you want to see more examples, there are many, many more, of course, on the Quarto website.
So that's going to pique your interest a little bit in Quarto. I highly recommend a talk by my colleague, Tom Mock, Reproducible Publications with Python Quarto, which is going to be in two days' time, two hours ago.
Shiny for Python
Okay. So that's Quarto, which is primarily about publishing documents. And I kind of talked about mostly static documents, but it also allows you, it also has support for particularly observable JavaScript, so you can do within-page interactivity. But there are some tasks that you need kind of like full interactivity. You want to be able to drag a slider that sends issues, a query for a database, or retrieves some data that fits a model and shows the result back. And for that sort of need, we have Shiny. So Shiny was originally an R package, and now it has a Python version as well. And it's really designed to create interactive apps and dashboards, so that you can help decision makers inside your organization, like, see what's going on with the data set.
So I'm going to start with a very simple example from Shiny Live. So Shiny Live is powered by the kind of magic of Pyodide and Wasm. So here I'm running like Python and PyShiny fully in the browser. So here I've got a little PyShiny app. And you can see, as I change the slider, that the histogram changes.
So how does PyShiny work? Well, there's two main components. First of all, we're going to define the UI. So here we've got a page that contains a sidebar. That's this guy, which contains a slider, and a main panel that contains a plot. So Shiny kind of separates out the view of the page from the interactivity. And the interactivity is provided by the server function, which uses some decorators to annotate this function. So this function is called histogram, which lines up with the, by convention, lines up with the name of this plot in the UI. So when this function runs, it's going to automatically draw this histogram, and that histogram is going to appear in that main panel. And the thing that's neat about Shiny is that you don't have to be, you have to explicitly declare the dependency. Like Shiny is going to see that this plot is using the number, this interactive slider for the number of bins. And so whenever this changes, Shiny is going to automatically update that plot.
So this is a very, very simple example. Shiny can also do very complex things. I'm just going to show you this kind of cool example that my colleague Joe Ching put together for PyData NYC. So here we have a 3D chart. And the kind of cool thing about this, the scrutinously cool thing about this, is I can control that by moving my hand around in the webcam. Reads my hand position, feeds that into the Shiny plot, Shiny and rotates the plot. So I don't really, I don't want to go into the details of that at all, but just to show you that the power of Shiny is, it goes a very, very long way.
So Shiny has this kind of dual design for both data scientists and software engineers. If you're a data scientist, you can start creating web apps, interactive web apps with like very little HTML, CSS or JavaScript skills. It uses this reactive programming model, which makes it interactively easy to get start with. And it builds on our many years of Shiny for R and seeing what data scientists actually want to do. But it's also designed for software engineers. So if you know HTML and CSS and JavaScript, you can use that. And you get to like learn about this really kind of amazing programming paradigm called reactive programming.
And just sort of very, very conceptually reactive programming is really all about creating a DAG, a directed acyclic graph from your inputs to your outputs. And that what Shiny does is when one of your inputs changes, it knows how to automatically invalidate all of the things downstream and recompute them as needed. And this reactive model is relatively simple, but surprisingly rich. It gives you all of this kind of, once you master the idea, it gives you all this stuff kind of for free.
Vetiver for MLOps
The last thing I want to talk about today is Vetiver, which is a set of tools for R and Python for MLOps. So that of course begs the question, what is MLOps? And there are a lot of competing and conflicting definitions in play today, but kind of our framing of MLOps is a set of practices to deploy and maintain ML models in production, both reliably and efficiently. And here we're thinking mostly about kind of human efficiency. How do we make this as easy as possible for the data scientists?
So Vetiver stays out of the initial model building process where you collect data and understand and clean it and visualize it and try a bunch of models, evaluate them. You bring your own, whether that's XGBoost in R or Scikit-learn in Python, Vetiver is going to support you no matter what you do. Vetiver starts to play when you want to get that model into production. And if you're going to put a model in production, we really believe the first thing you need to do is version that model. And that's really important because it allows you to track how it changes over time. And if you accidentally screw up, you can easily revert the previous version.
Then Vetiver is going to help you deploy the model. In the most general case, this is basically developing a Docker, creating a Docker container that runs a server that exposes a JSON API that other services can hit with data and get predictions back out. If you're using PositConnect, our tool that helps data scientists communicate with others in the organization, this all gets handled behind the hood and you can deploy your model with one line of code. Importantly, this doesn't just deploy the model, it also deploys some documentation. Currently, the documentation for the API, like how you actually use it. But in the future, this also is going to support publishing documentation about the model itself through the popular model card framework. And then finally, you're going to want to monitor that model. And because you've got all these versions of the previous model, very easy to track what's going on, what's happening to your model.
If that sounds interesting, I highly recommend attending the talk by my colleague, Isabel Zimmerman, Practical ML Ops with Vetiver Models, which is happening in one day, two and a half hours ago.
Wrapping up
So, that's kind of a lot of content to kind of sum up briefly. Like, yes, R is a weird programming language. And some of the things that I think, I truly believe are really amazing features of R are going to seem very surprising at first, if you're coming from pretty much any other programming language. They certainly took me aback at first when I started using R many, many years ago, but they just give you like so much. So, they allow you to do so many cool things that you can't do in other programming languages. They really encourage you to look at R with an open mind and think, well, like, what can I learn from R? What can I do in R that other programming languages can't do? Like, what's interesting? Not just like what's weird and sticky.
So, the company I work for, what's formerly called RStudio, now called Posit, is not just about R. It hasn't really been just about R for a number of years now. And we've changed our name to reflect that. And, you know, I just want to kind of recognize that I've shown you three tools, three open source tools that we're working on currently. Quarto for publishing mostly static documents. Shiny for publishing interactive web apps and dashboards. Vetiver to support your ML Ops process. We are working on these tools to embrace this reality that most data science teams are not unilingual. Most data science teams are multilingual, and we want to build tools that help everyone work together as effectively as possible. Thank you.
Q&A
Hedley, this was awesome. This is such an incredibly packed talk with a very wide array of useful information. So, I appreciate it. The demos were also super cool. The visualization that was showing around your hand was awesome. We've got a ton of questions. So, I think let's just dive right into some of these that came up during the talk. So, we'll go to Ron's question first. Ron was saying that you mentioned that R functions don't need signals, hopefully I'm pronouncing that right, in order to get their arguments as ASTs. Unlike, say, Julia, where macro calls are prefixed with the at sign. Does this have downsides for readability?
Yeah, absolutely. Like, there's a massive kind of potential foot guns here that it is possible to write R code that, like, looks like one thing and does something completely different. I don't know, R, I guess, is sort of a language of, like, personal responsibility. As a language, it doesn't provide as many guardrails as other languages, and so you basically have to adopt conventions. And I think mostly that works because, like, folks aren't going to develop these, you're not going to develop this kind of complex, you're not going to take advantage of these complex language features as a data scientist. You're just going to use packages that take advantage of them. And that kind of scopes the problem down, I think, to be much more manageable.
Yeah, no, that makes sense. Another question that came in, not from the YouTube chat, but on Discord. Somebody was asking, maybe for someone who's never programmed in R before and thus hasn't used Shiny, you talked before about sort of building the Shiny version in Python, and they're asking about what are some of the advantages that Shiny brings that maybe a visualization or dashboard tool like Dash, for example, in the Python ecosystem. Yeah, so why do we need Shiny for Python, I think, is the concise way.
Yeah, that's a really good question. I think it comes down to this idea of reactivity. Like, if you're creating something simple, where there's like a pretty straightforward linear flow, like Streamlet or Dash, really, really easy to use, like, really easy to get up and running with. With Shiny, like, to use Shiny effectively, you have to learn a little bit about this reactive programming model. And it's basically our belief that if you put in some legitimately hard work doing that, that's really going to pay off when you start to create much, much, much more complex apps, where there are many changing inputs and many intermediate calculations and many results. The way that reactivity works allows you to kind of create these things that just don't turn up and turn into this nightmare spaghetti of, like, events changing things. And then you can change one thing and sometimes things change that you don't want to change. And other times things don't change when they should. Reactivity is just such a great model for solving that problem that we believe that a little bit of investment there kind of pays off in the long run.
Yeah, no, that makes total sense. Awesome. There's so many good questions. Another one coming in around, you know, you talked before about how so much of your experience has been in the R ecosystem. And now that the sort of transition to also building tools and other ecosystems has happened, what are some of those areas of friction that you see in the Python space? And I'm sure some of the open source products that you talked about today are actually helping address some of those things. But any other ones that are your top of mind at the moment?
Yeah, I mean, it's hard for me to answer this without being cruel to Python. But just like when I look at Python code, it just seems like there's so many opportunities to, like, express things. Like, I mean, some of these things, like, you just can't do better in Python. Like, the limitations of language mean that tools like pandas have to, like, really jump, really have to fight against the language to give you this fluid syntax for data manipulation. And then not to mention, like, this whole, like, coming from the R community, this whole kind of, like, virtual environment thing. Just, you know, I'll watch, I know, like, I don't really know, like, I don't really know about this as a problem. I just see people, like, covetching about it on Twitter. But, like, certainly the fact that an R user don't have to worry about that most of the time, that seems really cool.
But, like, I don't know, I don't have any, like, specific things, like, in mind currently. Like, certainly over the years, I've learned a lot from the Python ecosystem. I think there's a lot that the Python ecosystem can learn from R. And I think, really, my message is, like, it's so easy when you go from something that's comfortable to you to something that's new and it's strange, it's just so easy, or at least it's so easy for me to be, like, no, that's, like, wrong. Like, it's not different. It's wrong, it's bad, and I don't want to do it. And I think the more you can, like, kind of fight that, like, programming language xenophobia, like, the more you can fight that to cultivate, like, curiosity. Like, oh, that's strange. Like, I wonder why they do that. I think that's such a powerful mindset to kind of learn from others.
And I think the more you can, like, kind of fight that, like, programming language xenophobia, like, the more you can fight that to cultivate, like, curiosity. Like, oh, that's strange. Like, I wonder why they do that. I think that's such a powerful mindset to kind of learn from others.
Yeah, and I appreciate that about your talk, sort of introducing these ideas in R that might sort of be a little bit different for people who are maybe coming from a different programming ecosystem before. So, I think that's a very important thing to highlight. Ben's asking about was there a hint that maybe a CRAN for Python is coming? And I'll build on this very slightly as well, just for somebody who doesn't have our experience. Where do people publish packages if they can't meet that sort of high bar that's being set out by CRAN? Like, is there, like, an unofficial sort of package registry that people put their stuff into?
Yeah. So, if you can't get your package on a CRAN, you basically just publish it to GitHub. There's no, like, repository, but there's tools that make it pretty easy to install it and then compile it from source. There are other projects like R Universe, and to kind of a lesser extent, DRAP. So, DRAP lets you build your own kind of repository, so you can automate building the binaries so people can install them themselves. And R Universe is a hosted service that will do that for you. But absolutely no hints that we will be building something like a CRAN for Python. Just, like, I call this, like, the sheer hubris of, like, trying to solve the packaging problem. For Python, we're, like, so many people have tried and failed before. And if you don't succeed, you just make the problem worse, because now there's, like, one more packaging solution that people need to hear about. So, I think, like, as I have matured as a programmer, I have learned that sometimes it's better just not to tackle things, because if you fail, which is likely in many complex problems, you just make the problem worse.
Yeah. No, I love that. That's a great piece of wisdom. Another question coming in, and I'm sure this is something that you get all the time,