
Lewis Kirvan | Sometimes you just need words | RStudio (2022)
This talk will trace the evolution of a report from a mostly text free dashboard into a text heavy R markdown report with dynamic text blocks. The report in question is provided to the largest financial institutions in the U.S., but the audience for the data largely is composed of compliance experts and lawyers. The interface between data products, and people who make decisions is often the most difficult piece in a project. Frequently, what your audience really needs is words! This talk will help you recognize when you need more narrative and will provide some helpful technical advice to get you there, including how to use existing word templates and how to use whisker:: and glue:: to help you dynamically generate text. Talk materials are available at https://github.com/lmkirvan/presentation Session: RMarkdown and Quarto
image: thumbnail.jpg
Transcript#
This transcript was generated automatically and may contain errors.
My name is Louis Kirvan. Thank you all for coming. So I don't have my notes, so I'm going to do my best because I can't extend the displays on this computer, but I think I'll do okay.
I'm Louis Kirvan. I'm a research manager at the Consumer Finance Protection Bureau, and I'm supposed to say this. I am not a representative of the U.S. government. I am just myself right now.
The point of this talk is to help data analysts with words, and I think words are actually super important for data analysts. If you've ever communicated with a leader in your organization, you'll know that a lot of communication about data actually flows through words and that getting good at words is really going to differentiate you as a data person.
So the first part of this talk is about identifying situations when you're going to need more words. Part two is how to make words a little bit easier to work with. So this is focusing on a couple things, but also when you want to actually generate text, it's going to give you some tips, a few tips to sort of help you generate text. So that's the structure of this talk.
When do you need more words?
So this is probably the most familiar diagram at the conference, and everyone's seen this like way too many times. But this document really captures a lot about the data products process, the process of creating data products, but I think it leaves out one really important thing. You're actually in the middle of that cycle, right? And you're doing stuff and gaining context as that cycle sort of spins around you, right? You're actually learning about the data, learning about the analysis, learning about what the goals are.
So you might do some stuff like this. You might look at the application that generates the data. You might read a survey instrument. You might talk to application users. You might read the data documentation if you're extremely lucky. You might read relevant research or talk to experts that know about how and why the data was generated. In my opinion, that's all statistics and data science, too. And knowing about the context of your data is how you don't make really stupid errors.
So you did your analysis. You got all this context. And it's time to communicate. I was really good at this.
I don't want to knock on dashboards too much. I've built a lot of dashboards, actually, in my life. And this dashboard actually might be fine for someone. So I think that dashboards are fine. But when you reach for a communication tool, you want to think a little bit before you grab something that's very visually dense or has a lot of moving parts.
So before you communicate, you want to think about your audience. You want to bring people along on your journey. And a great first question to ask is how much of that context I built up during my analysis does my audience share? If they don't share the context, it's going to be a difficult journey. How much do you need to pack to get that person to the destination you want them to go to?
So I have a couple of limit cases here, examples from my own work. So earlier this year, I wrote a report to Congress. It's like a required by law, and it's about credit reporting consumer complaints. It's got six charts in it, two tables, yeah, okay, cool. Started in rmarkdown, and it's got 50 pages of context. Congress is one limit case. Congress needs detailed explanations of all the fields and all the key terms. They need to know about the data collection process, and they need to know about the law that governs the data collection, and all that context.
Another limit case is your immediate team, right? So a ways back, I made this dashboard, took me a day, got three charts in it, six KPIs, less than a paragraph of text. The labels are kind of terse. I don't really describe the KPIs, because there are KPIs, we know what they are. The data elements are just named what they are in the system, right? So this is the other extreme. You're likely going to be somewhere in the middle, right?
So just to kind of sum up that idea, less shared context means more context words are going to be in your data product. More shared context means you can kind of include less context in your product, but you should still document it, because you might forget, other people might work on it. So it's kind of a seesaw there.
So here's another example. Moving from an internal set of tools to something external. I like this example, because it's the same data presented to two different audiences. So the internal tool is an interactive Tableau dashboard. It's got like a lot of charts, dozens of charts, you know, Tableau is good for that. And then, you know, like the other example, the field names just correspond to the system names. It's kind of a typical KPI type dashboard for your team.
But when this team went to sort of report out on this stuff, you know, they started with this, and they kind of just started to repurpose it for external communication, you know. And they share this with banks, and we're sort of assessing their performance. And I knew, when I got sort of thrown into helping them, that this document was meant to travel. It wasn't just going to go to the person who works on this stuff every day. They were going to give it to their supervisor, and maybe their supervisor would give it to someone else. And it probably won't go to the board of directors, but like, it could travel. And so the context had to travel with the document.
So we have this much simpler version. So there's only three simple static charts. One kind of gives you a time series of your performance. Each one gives you your average, and then compares you against your peers, and against some sort of overall performance. Some of the charts from the internal dashboard are actually sentences and paragraphs now. So the names are all also defined in an introduction. You know, a sentence is actually, if you just like tell someone what the chart means, that's actually denser than a chart, right?
You know, a sentence is actually, if you just like tell someone what the chart means, that's actually denser than a chart, right?
I also, you know, included different text depending on thresholds and other stuff, right? So some of these sentences and paragraphs didn't really apply to some of these companies. And so we thresholded it, and they just don't appear in the document. So it doesn't like bloat, and bloat, and bloat, right?
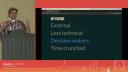
Summarize this with some key factors. The biggest one is external, right? If they're outside your org, they don't have any of your context likely. But even within your org, you can think about levels of externality, right? You know, there's your immediate team, and then there's concentric circles. And as you kind of move further away from your team, you need to be adding more context in.
Another key factor is if you're kind of dealing with a less technical audience. Less technical audiences mean you can't use shortcuts that you might use when you're communicating with a technical audience. You're not just going to present an ROC curve to your executive and say, hey, look, my model's really good. Because they're not going to get that, right?
Decision makers are important because they actually need context to trust what you're telling them. If they don't have appropriate context, they're not going to trust you, and they're going to reject your findings, even if you're right, right? You can pound the table all you want, but they need enough context to trust you. And I've had this happen to me. It's pretty disappointing, honestly, when you're like, look, it works.
Time crunched is actually counterintuitive in a way, right? Time crunched people, like, you want to give them as little as possible in some ways, but you're only going to get them one time, right? So those time crunched people have one shot, and if they don't walk away with the context that's necessary to understand this, they'll either misinterpret it, not interpret it, or forget about it, right? So those time crunched people are important, too.
How to make words a little bit easier
So the context here is you're generating text. I don't know if you've ever generated a document with a lot of text. What happens is your environment just gets littered with variables. There's all kinds of different variables. Some of these documents I put together are 10, 15 pages. You've computed 10 different means. They all have different names. And when you make a mistake, debugging is annoying and hard.
And so what you can do is actually add a language engine that will allow you to put templates in your rmarkdown document and then fill them with data. This is a really simple language, like, really simple function you can just add at the top of your Markdown file. It's a knitter engine here. And this works in Quarto. I just did it. This is using whisker, which uses mustache templates.
Options code, that's just the stuff that's in your code block. So you put your template in there. And then as an argument, you supply some data. And then it will render and make something nice for you. You can do it with glue, too.
So here's an example of just that concept of taking your namespace or using a list as a namespace so that you don't basically end up cluttering your namespace. So I'm generating one sentence here. And there's one, two, three, four, five or so, six variables. There's a bunch of variables just for one sentence. And what I like to do is when I have a document with some structure in it, like a section, I'll have a list. And I'll pack all the variables for that section into the list that's named the same. And then my environment stays relatively pretty, debugging gets easier, and my mental load as a developer doesn't sort of go haywire completely.
And so then when you go to do this, it's actually pretty simple. You have right here, this is a mustache template, a really simple one. Mustache is great. It's a logic list template. It's almost like Markdown in a way. But you can add some basically data-dependent stuff that will make stuff appear or not appear. There's a few other nice little features. But it kind of just works.
Using design resources
Design is like super-duper important when you're making a document that you want people to read. You need consistency and you need signposting to make the document useful. I kind of took a weird path to being a researcher and data analyst. I've got a degree in African history and a JD. So I spent like 30-ish years trying to make other kinds of good documents. So some of this stuff is natural to me. But I think it should be more natural to data analysts as well.
So someone at your org has probably thought about those issues, that signposting, that consistency. And they have resources for you. So you should steal them, basically.
So you have in your YAML a reference doc. The actual package comes with a reference doc. You look at that reference doc, it shows you all the styles that you need. And actually, Quarto has some surprisingly good documentation on Word styles, if you need some documentation on it. And so then you can either adjust the styles yourself, or you can actually copy and paste styles between documents.
This is actually a style from my org's DocX template that we use, or one of our DocX templates that we use. And I have no idea how to make that pull a quote in Word. I don't want to know. That sounds like a pain in my butt. So instead, I leveraged someone else who did know how to use that. And in my documents, I can use this feature.
This is cheating, because it's not really about words, but it saved me so much time over the course of my career that I just have to say it. If you don't have one of these at your org, a minimal package to package up your design system is super helpful. So you can put all your organization's colors into an easy-to-access list. This is going to save you all that time looking up hexes and remembering hexes. And then just a minimal ggplot that gets you most of the way. If you have one of these at your org, people will love you. I maintain the one at my org now, and people love me just for that, and I didn't even create it.
Partnering up
My tip number three is sort of a general life tip. Ask for help and partner up when you can. It really applies a lot with writing. Writing is really hard. Writing is really hard for analytical people because you have, like, high expectations for your audience. You shouldn't have high expectations for your audience, and a writer can help you with that, right? They can help you with lots of stuff. They can help you with grammar, the grammar for language.
They can give you an outside opinion, like, does this make any sense at all? And they can help you think about your audience.
Writing is really hard for analytical people because you have, like, high expectations for your audience. You shouldn't have high expectations for your audience, and a writer can help you with that, right?
