
Introducing an R interface for Apache Spark | RStudio Webinar - 2017
This is a recording of an RStudio webinar. You can subscribe to receive invitations to future webinars at https://www.rstudio.com/resources/webinars/ . We try to host a couple each month with the goal of furthering the R community's understanding of R and RStudio's capabilities. We are always interested in receiving feedback, so please don't hesitate to comment or reach out with a personal message
image: thumbnail.jpg
Transcript#
This transcript was generated automatically and may contain errors.
Good morning everyone. Thank you so much for joining today's webinar. Before we get started, I would like to review what you can expect out of today's presentation. First is that we have new slides and illustrations, so if you have followed Sparkly R for some time, hopefully today's material will be new to you. Also, the demo code that we're going to use today, I'm calling it reproducible, mainly to say that we're not going to use a large Spark data cluster or a yarn cluster that takes all this stuff and nobody can ever recreate that. I'm going to use local mode mainly because I want to focus on what Sparkly does, and because how cool it is that you can also do local mode and actually run Spark, I'll be able to show you some of the inner workings of Spark as well as we go through the code.
Even though this is not a what's new in Sparkly R today, this webinar, I will be highlighting some of the new features in Sparkly R. There's three specific features that I'm very excited about to share with you today, so we will be definitely reviewing those. As is mentioned here, the goal today is to share with you something new and useful, so if you have been using Sparkly R for a while, that one or two things that you can pick up today that you can try later or at home or something, that would be great. Or, if you're new to Sparkly R, that hopefully most of this presentation will be beneficial for you.
Architecture overview
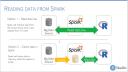
All right. So, let's move to the first slide. So, I was actually trying to look for something that would represent this overall architecture, and ended up just putting this together. Usually, we talk about, you know, Sparkly R and R, how Sparkly R provides a deep layer backend to Spark, how it also makes machine learning libraries available that are inside Spark in R, and that, of course, you can create extensions. But behind all that, I want to take a few minutes to review how everything starts from the storage and ends up in R with this method.
So, for example, we have big data storage sources, like, for example, HDFS or Hadoop. We can have an S3 bucket, databases, file systems, that all are accessed in Spark via a package. Now, these packages are not to be confused with R packages. These are Spark packages that are specific to the kind of data source that you're going to access, right? So, let's say that you want to access a Redshift database via Spark, then you would use a specific package to be able to do that, so that Spark can read the data. So, once Spark is connected to your big data source, then it opens the door for all these really cool things, like cluster computing, the fact that you can do all this stuff in memory is really big.
Also, the fact that you can extend the API, meaning that not only has things that come out of the box, like the machine learning libraries, but also you can create your own programs that can run in parallel. Another thing is that it provides a SQL interface when you're interacting with data, which is really good, because it allows a very easy way to start using your data with Spark, and it also enables something like the things like the deep layer backend, for example.
One of the most important things I want to mention here as a tip, or something that sometimes is not fully clear, is that Spark is not in itself data storage. All the data comes from the source, which sometimes causes some confusion, because you may have a different product, a data product that says, hey, we can access all these data sources, like Oracle, we can access Impala, we can access Spark. So Spark looks like a data source, but it's really not. That's because the product interacts with Spark, which in turn interacts with something in the background. But Spark doesn't have data. As soon as you turn off the session, the data that you would have cached in memory is gone, right? So that's very important to notice, because that will help, as you are working with Spark VR, how to manage those data frames and the data that you're interacting with.
One of the most important things I want to mention here as a tip, or something that sometimes is not fully clear, is that Spark is not in itself data storage.
So we mentioned that Spark accesses the big data sources via packages, and then Spark VR uses the Spark shell to access the Spark capabilities, and then it makes available to R all these cool things via R functions. So let's go ahead and dig deeper into this portion right here about the Spark shell and Spark VR.
The dplyr backend and invoke command
I wanted to illustrate how Spark VR not only opens the door for us to be able to use, when I say us, I mean our users, to be able to interact with Spark API inside R by providing a conduit where you can literally send API calls, right? It could have stopped right there, and I would have been extremely excited if Spark VR would have done just that, and so I can send SQL commands via an API call, but they didn't stop there. The guys that worked on this package also created wrapper functions that makes it very easy for us to access it, like functions where we can call machine learning algorithms, but simply call an ML underscore function or an SDF function, which stands for Spark DataFrame, or a feature transformer, or a Spark underscore functions.
All these are very easy to use because it makes sense in the R world, but in the backend, it's doing all these API calls in Spark that we don't have to worry about. Also provides a deep plier backend, like I mentioned, which we're going to dig in deeper in a little bit, so I'm going to table this one for now and move to the invoke command. So the invoke command is the one that enables us to do those API calls directly. If, for whatever reason, there's not a function in Spark VR that does what we need with Spark, then we can use the invoke command to do it. Now, the real purpose of the invoke command is to actually enable other packages to become extensions to Spark VR, so that other companies or people can create their own things via Spark VR and R to interact with Spark.
For example, H2O has a package that allows us to run H2O algorithms inside Spark through R via that extension package. So it's really cool. I think that the approach that Javier and Kevin and JJ took when they created this package, because it really enables and empowers us to be able to do a lot of things with Spark, and not only the one thing, you know, not only deep plier, not only the SQL, not only machine learning, it does open the door for almost everything that we have there.
Digging deeper into the deep plier backend, I think it's important to mention that if you already are using the tidyverse, then switching over to Spark VR, actually not to Spark VR, but to Spark is going to be a natural thing to do, especially as we see the code today. You can use the same mutate, filter, summarize functions with Spark data frame data, and instead of those verbs to run in memory, you know, with data in memory, it's actually running remotely and doing that data manipulation inside the Spark cluster. The secret sauce to all this is the fact that Spark VR actually translates those deep plier verbs and vector expressions into actual SQL statements.
So, an example that you can see here is, for example, using the TBL command and then a simple select verb gets translated into a SQL command that then gets sent back to Spark. Now, having said that, let me go back to that initial slide that I showed you, and I think it's really nice to mention the fact that the deep plier backend will do that, what we mentioned, does the SQL translation. That SQL statement gets sent to Spark, and then Spark, depending on the data source that's in the backend, like I mentioned, it could be Redshift, it could be S3, the file system, it then does the appropriate data, you know, transformation or data selection to get the data back, right?
So, we can send the same select command and flights could be 10 different types of data sources, and it will always work, right? So, it's abstracting that complexity for us, which I think is really awesome because it allows us to interact with a bunch of different data sources and keep a consistent interface. Having said that, the fact that it goes all the way back to the data source and then into Spark, that's one way that we can access the data, which, depending on the data storage itself, it may be slow or fast. We actually have more than one option to do this.
The first one is the one I already mentioned, the fact that you can go back all the way to the data source and get the data into R. But the second option that Spark has that is really powerful is the fact that you can also cache data in Spark, right? So, we can tell Spark to go ahead and take a piece of the data that's in the data source and keep it in memory, so that way, whenever we start interacting with the data, we don't have to go all the way back into a possible slow system and get to bring the data in. We can just interact with the data in here.
Obviously, ideally, we don't want to start just using this as a sort of ETL tool. We don't want to bring in all the data into R. We want to take advantage of dplyr to manipulate as much of the data and aggregate it before we bring the results back in. As I mentioned, there's no storage in Spark, so that remains true. What happens is, when you cache the data into Spark, as soon as we kill the Spark session, that cache data is going to go away. So, it's great while you're analyzing, but it's not going to be something that you can use for, for a lack of a better term, a persistent storage.
Demo walkthrough
So, for the demo today, we're going to review some of the Spark functions, and we're going to basically do a high level and kind of hit as many as we can, as many functions as we can, as far as types of functions. Also, we're going to switch over to the Spark UI during the analysis at certain points of the analysis, so you can see what's doing in the background. We'll also talk about reading and caching data in Spark. I mentioned that I'm going to highlight some of the new features in Sparkly R. I'm also going to share with you some of the tips and tricks. Okay, so let me switch over to the code.
And I started all the way from installing the new packages, right? So, this code, you can literally run it on your laptop, and it should work. So, I'm going to start by loading the libraries, and then I'm going to run this one, even though I already have it installed, so it's not a problem. Make sure that you run it at 210 Spark version. The first time you run this is going to take a little bit, but it's going to be worth it. So, this is where I want to actually start formally.
So, the first thing I want to mention is that you can start the Spark Connect with no configuration, but in this case, I do want to modify the configuration. I want to request 16 gigabytes of driver memory, and I'm going to request that 80% of those 16 gigabytes are available for me to use in my analysis. The default of this is 40%. So, if I don't pass this, it's going to give me even less than that. So, I'm going to run this, and I'm going to connect.
So, once it's connected, you'll notice that my tab may be called a little bit different. If you are in version 1, it says Spark Mindset Connections. That's because I'm using the preview release of the IDE, so that's been renamed to Connections, because it's been expanded to also include other kinds of database connections, which is another cool thing to mention, but still maybe subject for a different webinar. So, here we can see that we don't have tables yet, and that's because I just opened a local connection to Spark.
That actually creates a new session for me that I can go to the web UI. So, this is the web UI for my current Spark application, and I went directly. Normally, it comes in here just without having any jobs yet. I'm going to Executor to show you the fact that it gave me the 12 gigabytes, right, which is 80% of 16 gigabytes. So, I have 12 gigabytes already, a portion for my Spark session, and eight cores. So, that's going to give me all these capabilities. Obviously, if I had a cluster, it would be more executors here available to me, but in this case, we're going to have one because it's my local machine.
Next thing I want to do is I want to load some data. I have a script here that will allow you to copy the data into the right folder if you don't have it yet. So, again, I want to keep it as reproducible as possible. I have this little routine that will get the column names from those files. We're using two files for flights that are full year of each of the years mentioned here. It's there saved in my data folder.
So, when I run this command right here, the Spark read, what it's doing, it's creating a new flight stable in the Spark environment and also is pointing Spark to that data folder as the data source. I'm telling it not to cache it in memory and to use the file columns variable that I loaded here and not to try to figure out the schema. This actually saves me a lot of time because usually if I don't pass these two, then the command will run a lot slower.
And switching over here to storage, you notice that I don't have anything yet, right? That's because all I'm doing is I'm telling Spark where the files are. Even though I've only done that, you notice that that variable that I'm equating to the Spark read if I run this, it's only giving the size of it. It's only, you know, 9,936 bytes. So, it's obviously not all the data. That's because it's just a pointer to that database, to that table.
Actually, not even a table, right? It's the data. But I can actually access it directly here if I were to click this button, the table button. It's going into these files and treated them as if they were a data source, right? And it's giving me a preview of my data right out of my interface here.
Another thing I can do is, of course, I can start interacting with my data using SQL. So, I'll run this command right here. And I'm going to use the library DBI package. And I'm going to use the get query function from DBI to pull the top 10 records. I made this available because I want to highlight the fact that whenever you run DB get query, you're actually bringing back the data into our memory. So, it does create a data frame, right? This is important to mention because if you're going to use DB get query and you don't do limits or aggregations or something, it's going to try to bring back all of your data. So, just watch out for that. You may end up with a SQL statement that's either going to crash your session because it's trying to bring too much data. It's going to take forever to run.
Another cool thing is that we can run SQL statements inside an R chunk. So, you notice how usually we have R, the beginning of a code chunk and R markdown. If you rename that to SQL and then point the connection to that variable, the SC variable, then I can actually run it directly here. Very useful whenever I'm trying to use the double quote here. I would have to do more things to make it work if I want to use double quote. So, that's one of the times I've seen it makes it much easier, especially if I'm copying and pasting a SQL statement from somewhere else just works directly in the code chunk.
So, that's another way that we can interact with SQL, excuse me, with Spark using SQL. And you'll notice, too, and I think the biggest point that I forgot to mention is the fact that we are using SQL statements to interact with data that is not a SQL-based database. It's a file system. So, that's another cool thing that you are able to do now with Spark, just like we mentioned, right? We send in Spark SQL and Spark is taking care of the data retrieval for us.
We can also use dplyr. So, let me turn off some of these code chunks. All right. There we go. So, with dplyr, the same SPFlights variable that we used to load, to read the data in, I'm using mutate and select just as an example of how we can interact with the data. So, instead of having to write the SQL ourselves, we can use dplyr to start selecting data and do some data conversions here. Same thing, right? The flight stable is only a pointer and it's not bringing the data back.
The next thing I want to show you is show query. So, I had SPFlights, which is pointed to the flight stable. And I'm going to tell it to just give me the top rows. I can run this. And notice that because I have show query at the end of this code segment, it's actually giving me the SQL statement that I'm using. This is a very handy tool just to figure out, especially if you're having errors, why it's not running like you want it to. Why is it giving you an error? But another way that we found becomes very useful, especially from feedback that we've gotten from commercial customers, is the fact that you can have more complex dplyr code right here and then translate it into SQL that then can be shared with other team members inside the company or the team itself that may take that SQL statement and run it in a different tool, right?
So, not only gives you the ability to transform data easily, but also gives you the ability to take that SQL statement and share that same analysis with others via that SQL command. So, that's something that we found out and it makes sense. So, show query is another thing that we can use.
Caching data in Spark
All right. So, let's talk about caching data in Spark. So, I'm going to run this as I'm talking here. And what it's doing is doing a simple tally, which of course is the count asterisk. As it's doing that, I'm going to switch over again to the interface here. And you'll notice that the job is still running. So, it's going to take a while. And as it's running, I think it's important to mention, too, that if you're new to Spark, it's important to note that every time you run something, it's going to create a job, right? So, right here, it finished it. And if you were looking at the background, it ran here. So, it took 22 seconds to count 13,617,000 records.
So, that's a significant amount of time. And what it's doing, of course, is going to these files and doing a full file read and getting all the rows and putting them back. So, that takes a long time, you know, 19 seconds. So, in order for us to be able to get this performance up, we're going to have to bring that data into Spark memory. And we do that using the compute command, which is one of the this is the first command that is new to Spark VR, we can say, that I'm very, very excited about. Because usually, you will have to do SDF register and then TVL cache to get the data into memory. But now, compute does both for us.
And what this is going to do as I'm running it, of course, you'll see that creates a new job, right? So, everything we do in Spark is going to be a job. So, it's going to take a little bit here. And it's running. I want to get to one of nine so I can switch over to storage. And this is very common, too, as you start working a lot with Spark, clicking and clicking jobs. There you go. Going back to storage. See how it says flight subset, which is the name we gave it here in the compute? It's 13% cached. So, now it's 100% cached. So, now, it took the resulting the results of that with deep layer code and cached it in memory. So, now, it's cached in at 358 megabytes. And it's split in eight partitions. These eight partitions, each one of them is around 45 megabytes.
So, it's pretty big. But still, now, it's in our RAM, right? And it's taking some of that 12 gigabytes that we requested for the driver. So, now, this is computed. I'm going to run the same tally command. But you notice that it was immediate, right? And if we switch back here, you know, everything creates a job. It was less than a second, right? Half a second to run.
So, you can see, even in local mode, how, you know, how much performance you can get out of caching your data. And how important that is for data analysts, right? Because then now, this allows you to iterate constantly over the data without the tax of having to go back every time to get more information or wait for it to read the files again. That would allow us to do more. I'm calling it complex aggregations. Obviously, this is not complex. But if it took 19 seconds just to do a straight count, can you imagine how long it's going to take to split it by the origin? This would be the airport origin. And then give me the count, it would take forever. So, I wouldn't venture myself to do that without having my data cached.
So, you can see, even in local mode, how, you know, how much performance you can get out of caching your data. And how important that is for data analysts, right? Because then now, this allows you to iterate constantly over the data without the tax of having to go back every time to get more information or wait for it to read the files again.
Sampling and new dplyr features
Another cool thing that we can see in Spark ER 0.6 that I want to highlight is an improved way of doing sampling. So, if you use sample frac or sample in, you can use the same one in Spark ER. And if you tried it before 0.6, it was probably really, really slow for you. Just know that that's improved now. That's going to be much faster than before. And it's going to take a little bit while here. But it is much, much better than it was. Because it's using a more native way of sampling to Spark than to do a more complex operations like it was doing before.
Another tip I want to mention is the fact that between sample frac and sample in, inside Spark, it's just the same table sample command. But for some recent table sample with just a number, like a sample in, doesn't work as well, in my opinion, as sample frac. The result here, you notice that between the two years that we have in the data, it's pretty even bringing in the data from both files. When I try this with sample in, it actually just brings more data from 2003. I tested this sometime back again, and it was the same thing. So, our recommendation is that you use sample frac and use a fraction of the data. Just as a tip. Again, this is not a Spark ER thing. It's more of a Spark, you know, how or even high selection, how it works.
New and deep layer. So, if you attended Hadley's latest webinar talking about what's latest, what's new in deep layer, we've had pool and case when. I wanted to bring out that pool and case when does work in Spark ER, and I think it's really, really nice, especially pool. I use it all the time. It lets you take the first column, if I don't pass anything, or if I pass the name of a field, then it's going to take that field and bring it back as a vector. Of course, this is a character vector that I can then use all those things. Very convenient, because we always end up having to do some subsetting after running a command. Whenever you use pool, you don't need collect, so it makes it very convenient at the end of my chunk here.
Right now, we're using it for an actual analysis, right? So, we're telling it to give me the top five airports with the most activity, right? So, we have the top five here ordered by how much activity they have. Case when also works, and I did a quick one here, as far as if it's origin, it's the biggest, and then do use numbers, depending on how many flights it has, and everybody else do a default variable, so if it's over 200,000, it's big, over 100,000, it's medium, and everybody else is small, and then you can see that working, and you saw how fast that is. I'm not running this in our memory, right? Everything is ran in Spark, and it runs really fast, because how optimized it is here, and the fact that it's broken out into smaller files.
SDF functions and feature transformers
I mentioned SDF functions. This is the second function I want to highlight, because I think it's really awesome how it works, and we've had a lot of customers and folks that just are using Sparkly are asking about, you know, what about spread? You know, tidy R, I always use spread, and I have to bring the data into memory, and then do spread there, so now, with SDF, you can do basically the same operation, and for those of you that haven't used spread yet, I want to show you basically the concept of it.
So here, if I were to have the data grouped by origin and destination, I'm taking my top five airports, and then I want each, instead of having each combination like this, but rather, I want to see just one line for DFW, one line for ORD, one line for AAH, and then a column for each of the destinations and the number inside those columns, right? If I want that crosstab, you know, look to it, you can actually do all that inside Spark by just sending that to SDF pivot, so I'll run this, and the pivoting itself is taking place in Spark.
So, I'll pause here for those of you who's been wanting this function for a while to, you know, catch your breath a little bit. All right. So, feature transformers. I actually didn't use feature transformers as much, but then I found out that there's more to Meet.ai, hopefully, you got that reference. So, the first one I want to show you is the feature binarizer.
That one will let us do something really cool, which is, if a numeric column is over a certain value, then it's going to send a value of one, and if not, it's going to be a zero, right? So, in this case, it's working with flights. Let's say that we want to tag anything that is considered a delayed flight, which is anything that's over 15 minutes. So, if I run this, you'll notice that I tell it to look at the departure delay, and if it's over 15 minutes, then create a new column called delayed, and make it one if it's over 15 minutes, right? So, you don't have to use if else, you don't have to use more complex logic to make it work in SQL or in DeepLayer, you can just call feature binarizer, and you get that functionality.
All these feature transformers are meant for data preparation for analysis, right? So, we'll see that in a minute, how we can actually combine all these. Feature bucketizer is another really cool one. This one allows us to do basically the same as cut. So, I can send it the splits, and it takes a sample here, the departure hour, excuse me, the scheduled departure, and then depending on the time range, it'll give me a number, right? So, if it's zero to 400, it's going to be zero, 400 to 800 is going to be one, 800 to 1200 is two, and so forth, right? So, this will let us create, you know, those more, you know, segments inside our data that then we can use for other things like, of course, running as a model. Another way that I found that's very useful is if you want to create a histogram with it, that it's much faster to run a feature bucketizer than try to do this with a SQL statement to create the buckets, because obviously it's using a lower level API inside Spark.
Machine learning and model training
All right, so, going to machine learning libraries here, before we go into that, I want to show you here how we can combine dplyr verbs with feature transformers, with SDF functions, and get them to all work together to run an analysis. So, a new feature, a new, excuse me, function here is that SDF partition, so I can get it where, I can tell Spark to run the training, I create a subset for training at one percent of the data, a subset for testing at nine percent of the data, and then hold everything else for 90 percent. So, SDF partition requires you that the total of this needs to be one, so this is normally how I do it, because I don't want to split it, you know, 40, 50, because the data's too big in this case, so I want to use just one percent to run a demo training today.
Usually you would be able to do, like, type it and then compute here, but what happens here is that sample, excuse me, SDF partition actually creates one Spark data frame for each of the splits, so you have to specify which ones you want to cache, right? So, in this case, I cache training, and it's important for me to mention here, so now we have training, right? It's a much more smaller set at five megabytes, and it's also partitioned in eight partitions. This is, I want to mention this because we're going to come back to this because of a different function that I want to show you.
All right, so I'm going to train the model here. I'm going to use logistic regression, so delayed is the same one that we used earlier using the feature buttonizer, so zero, one, just delayed or not. Departure delay is a continuous variable, and then departure hour, which is that one that we use as a feature bucketizer, but in this case, I did this, I used a paste to add an H to the hours to make sure that it uses, it's recognized as a categorical variable instead of a continuous variable.
I'm sure there's better ways to do this, so I apologize if I didn't do it the best way, but this worked pretty well for me, so again, I want to just kind of give you a sample of what a model would look like. I ran an SDF predict, so that's the name implies that we run into predictions, but instead of running in over the training data, we're running over testing data. I didn't cache this data because you saw that it runs pretty quickly, so it's okay. It all depends on how big your data is. I want to show you the top records because there's some differences on how a predict works here, the SDF predicts specifically, and the difference is that it will return the same data set that you sent to it, but with more fields, and you'll notice that immediately we can see that the departure hour has been, actually Sparkly R has created dummy variables for us for each of the values inside departure hour, and it returns a prediction, right? So, we have a prediction of 0 or 1, and the actual value of 0 or 1, so now we can see how the model performs here.
So, I'm going to do, I'm just going to compare it and see how I do it. There's obviously much better ways than doing this, you know, but I guess I want to highlight the fact that you are able to run those models inside Spark without bringing your data back into memory, just as the results in this case, right? So, we can see our false positives, our true negatives, you can see which ones were false positives and true positives, so they're okay, and we can iterate through the data. Of course, we have cached training data, so if you want to test different models, it's not going to take forever to run.
Distributed R
All right, so our last feature I want to talk about today is distributed R. We've had several people and customers asking for this, the capability of being able to take an R function and run it in Spark, right? This is a big, big new thing that Sparkly R has in this next version. So, because it's brand new, I definitely suggest that before you start writing up solutions using it, that you test it real well in your cluster before you implement it. We're constantly working on improving it, so I think in itself already it's worth showing it to you today so you can see how it works.
So, I'm going to run Spark apply, which is the command that we will use to be able to distribute R data, excuse me, R functions in Spark, and I'm just going to use a very simple one called nrow, right? So, the nrow command, we would expect to return one number, but actually return eight, and what that means is what it's doing is taking the count from each of these RDDs in Spark and giving us the count, right? So, inside this 700 kilobytes memory chunk, it's around 18,000 records, right? So, this is okay, because we can run it over each of these data frames, but normally we don't want the data grouped by the RDDs. We want some sort of custom grouping.
So, the team has created this group by argument that you can use to run that parallel deployment of your R code, right? Because that's usually what you want. Why do you want to use R code in Spark? Because you want it to run parallel, you want to run the same machine learning algorithm over specific categories, the same, you know, whatever function over those categories. So, you want to use, that's the reason why, right? So, then you have this, and now I can group it by the departure hour, and the last one, and I'm running out of time, is the fact that you can run something like a broom function, and run essentially the same GLM function over each of the origin airports, and it will return a tidy data set, but all this did not run at any point inside my R code.
So, very excited about this. I think it's really cool. I hope you start testing it, and giving us some feedback, because this will open a lot more doors of how you can use Spark, and Spark VR. Hopefully, this will be one of the tools in your tool set. You saw how we can effectively use the other pieces and other functions that make this combination of tools really exciting. Okay. So, I think this is the end of the demo. Let me go back to ...
So, the team has created this group by argument that you can use to run that parallel deployment of your R code, right? Because that's usually what you want. Why do you want to use R code in Spark? Because you want it to run parallel, you want to run the same machine learning algorithm over specific categories, the same, you know, whatever function over those categories.
Q&A
So, thank you so much, Javier, and I believe Jim Hester were answering questions, so they marked some here for me. It says, the first one says, when the line read CSV is run, is the data loaded in memory or not? Where does the data reside? Good question. So, you notice that you have in-memory true, right? So, if you say true, then it's going to go to that storage section in here. But, if you set that to false, then what it's doing in the background, it's actually creating a sort of mapping that's just like a temporary mapping of how the files are put together. So, essentially, it's still partitioned, but virtually, we can say. If I had time, I could show you more about it, because you can actually go into the Scratch folder inside Spark and see the files that it creates that are the mapping files. So, that's how that works.
Any suggestions on when we do cache, load all data into Spark memory? What if the memory is not big enough to store all the data? Yeah, so, that's a very good question. So, I think it depends on what you're doing at that point. So, if you're doing an EDA, for example, then one of two things would be possible, especially if you're limited on the amount of memory. One would be to only bring in columns that are of interest, right? So, there may be some, you know, junk columns that we don't want to, we don't really care about. I think, for example, here I can show you, like these columns, all these NA columns, I would never bring them in, right? So, I would subset it and then try to see if that subset of columns would fit. And, if not, then you can always do sampling, right? And, as I showed you, sampling with the sample frag works pretty good as far as getting a good sampling over all the data.
So, are there helper scripts available for installing on common infrastructure, such as AWS, EMR, and all those? That is a very good question. I'm actually going to have another webinar about deploying Spark PR and Spark, then I will cover that at that point in time.
Let's see. I think I saw one about plotting. Okay. I am very, very passionate about visualizations with big data. So, I will mention real quick that, obviously, for plotting, you cannot plot in Spark right now. So, you have to bring the data back into R for plotting. So, as I mentioned earlier, one of the techniques that I use for, like, histograms is to bring the data back using, excuse me, calculate the buckets in Spark and then bring the results and create a histogram, for example. Or you can do two bucketizers, right, to create some sort of raster plot. So, yeah, there's definitely ways that you can take advantage of Spark's capabilities, but you would have to do the calculations of the plot inside memory and then bring the results back. It's daunting at first, but once you get used to it, it's actually really easy to replicate. So, I would definitely encourage you to take a look at that.
Oh, there's more questions coming in. Okay, cool. So, how do we know how much memory it's using? What if the memory outflows? Good question. So, for you to know how much memory is being consumed, obviously, your limit is, in this case, 12 gigabytes. But if you go back to executors, you'll be able to see how much is being used out of those 12 gigabytes at any point in time. That will tell you right there.
And also, you can see it here. It says Spark VR to be very slow compared to PySpark. I would like to know what kind of methods you're using with Spark VR, because as I mentioned, Spark VR's approach to accessing the Spark, where are you at? Yeah. Accessing the cluster is just through Spark Shell. So, there's nothing else that we do other than call the Spark Shell commands. So, I'm not sure if, yeah, and I think Javier just answered to open a GitHub issue. Yeah. All right. And all this code and the presentation will be available, as I mentioned, in our GitHub. It's going to be rstudio forward slash webinars.