
Covr Test Coverage | RStudio Webinar - 2016
This is a recording of an RStudio webinar. You can subscribe to receive invitations to future webinars at https://www.rstudio.com/resources/web... . We try to host a couple each month with the goal of furthering the R community's understanding of R and RStudio's capabilities. We are always interested in receiving feedback, so please don't hesitate to comment or reach out with a personal message
image: thumbnail.jpg
Transcript#
This transcript was generated automatically and may contain errors.
So today I'm going to be talking about covr, a package that aims to bring test coverage to the R ecosystem. My name is Jim Hester. I'm a software engineer at RStudio. I work with Hadley to write tools that make data science easier, faster, and more fun to use.
State of testing in the R ecosystem
This table is simply showing the current state of testing in the R ecosystem across various package repositories. So for the CRAN repository, there's about 10,000 total packages, about 2,000 of which have tests, which equates to around 20% of the total packages in CRAN with tests, at least some form of testing. In the Bioconductor repository, that proportion is a bit higher. About 35% of Bioconductor packages have tests, albeit with smaller number of total tests, a little over 1,000 total packages. And ROpenSci, with a much smaller dataset, only 150 packages, but has over 50% of those packages with some testing.
So tests are a focus of the ROpenSci organization, so it's good to see that their packages are being tested. So all told, around 23% of the total packages have some form of testing.
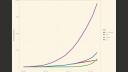
So this plot is showing that's a similar dataset over time. So the x-axis is the time from January of 2000 to today. And you can see the number of packages in the CRAN repository, so this dataset is only packages in CRAN, has been rising exponentially over that time and is now nearing 10,000 packages. The blue line is the packages that have at least some tests. And the red and green line is the blue line stratified by whether the tests are using the TestStat infrastructure or some other type of testing framework.
This plot is the same data as the previous plot, however now looking at a proportion of the total number of packages rather than absolute counts. The blue line is the total number of packages that are being tested, and you can see it's now over 20% in CRAN. The red and green line is the data in the blue line stratified by whether they're using the TestStat framework or some other type of testing framework such as RUnit or an ad hoc framework. You can see that in the past five years or so, the proportion of packages with tests has been dramatically increasing, and this seems to be largely driven by packages using TestStat for their testing framework.
I think this is a very encouraging plot as it shows that more and more R packages are including tests, which should make for a much more robust ecosystem with fewer bugs in the future.
Why testing matters
So why do I think testing is useful? Firstly, for package authors to ensure that their code as it exists and as they write it is correct. Secondly, for future contributions to packages that they do not break existing behavior and that they themselves are correct. So this is not only for outside contributions from other authors, but also contributions from the authors themselves, so from their future selves, that they don't break existing functionality when they write new functions. And lastly, for users as sort of a badge of confidence in a given package and a way to show package quality.
So if a package has tests and a user can be more confident that those tests are covering a large proportion of the package, the user can be more confident that the package has been well tested and is less likely to contain bugs that they may run into.
What is test coverage
So test coverage. What is test coverage? Test coverage is simply the proportion or lines of your code, of your package code that is actually ran or tested by your test code. And probably more importantly, it is also the lines of code that are not tested by your package code.
So covr is a R package I started writing in December of 2014. It supports local reports of your testing coverage and interactive use, as well as support for use on continuous integration servers such as Travis and also Jenkins. It supports R code, including S3, S4 reference class and R6 methods, which is all of the primary object oriented systems in R, as well as compiled code in C, C++ and Fortran in R packages. That's included in your R package. Up until now, we've been talking only about tests, but covr also supports running on example code as well as vignette code. So it works not only for your actual test code, but also those other two types as well.
How covr works for R code
So how this works for R code is fairly straightforward. If we define a function f with two statements and then call the trace calls function on it, covr transforms the body of the f function to have two counting statements. And these counting statements can be used to track exactly what lines or statements have been executed by that function. So basically what covr does is takes all of the functions in your package, replaces the bodies of the function by the modified function definition returned by trace calls, and then runs your test code on that modified code. You should notice that the counting calls do not actually modify the results of any of the code that they're tracking.
So for a more complicated example, this is a function with a switch statement. You can see for each condition in the switch, each one gets its own count call. So we can then easily see exactly which conditions were executed by tallying up these counts.
Compiled code coverage
So for compiled code, covr uses the gcov extension that is provided in the GCC and Clang compilers. So to enable this, you need to compile your code without optimizations and with the coverage argument. And then you run your testing code as normal. So what that does is instruments the compiled code with coverage information, which is output once the process finishes, and then can be aggregated by the gcov binary into gcov files, which are then parsed by covr and included with the results from the R code in one homogeneous report.
Using covr with Travis CI
So I mentioned that covr can be used on Travis and continuous integration servers. So how that works for Travis is you can add suggests covr to your package description, which will automatically install covr when testing on when you're running your code on Travis. And then in the after success block in your Travis config file, you add either the code cov or coveralls function call, depending on which of those two services you'd like to use. And then generates, you can then include a badge in your readme, which will make it easy for users to see exactly how much coverage your test coverage your package is using.
Interactive demo
Okay, so if we just want to make a new function, let's make a function add that simply adds one to a file. Devtools is a useful package written by and maintained by Hadley Wickham, which contains a function use test, which can be used to add a test file and all the testing framework you need for a new package. So let's say we can write use test add, which will add our new package or a new test file.
So we've made this function, we want to test it interactively first. We just say add one, add two. And this is what everyone typically does when they write a function and then test it interactively. So making a test is very simple. You use the Devtools use test to create the testing framework. And then you just write expectations for exactly the same thing that you just did. So add one, we expect to be two. And expect equal add two, we expect to be three.
Great. And then we can now run our tests. We're using Devtools test and we see there's two results, both of which succeeded. Then if we later want to change or extend our function to allow having a second parameter with how much we want to add, we say add one and two, it does equal three. So now we can add a new test with that new, and run our tests again. And we see, oh no, our first two tests are now failing because our new functionality broke our existing functionality.
We can verify that interactively. We just add one, oh, that equals three instead of two like we were expecting. The reason is our default was set incorrectly when we set up our new test. So now we fix that and we have a working test. So this is a great example of how testing can be beneficial even when you are the sole developer just adding new functionality yourself.
So this is a great example of how testing can be beneficial even when you are the sole developer just adding new functionality yourself.
If we now define a new function, we'll call this add even. What this will do is basically add only if the second input is even. Otherwise, it will just return the input.
I forgot to put my conditional here, so we'll say that's three. Okay, now we say it worked. All of our tests succeeded.
So now if we want to use covr to look at this simple package, the main function you want to use is package coverage, which will automatically build and test your package. So if you just output the object that's returned, it will give you the overall coverage for your package. So we see here our overall coverage, and also break it down based on the number of files in your package. So the overall coverage is 75%. We only have one file, which is also 75%.
If you want to look into this a little further, use the report function. And this first generates a simple report. This is actually a table, but we'll skip that for now. And you can look into the file and see exactly which line is missing coverage. So we only called add even with an even number. We never tried calling it with an odd number. So we have a missing coverage here.
So if you wanted to fix that, call it now with an odd number. And since it's odd, we're not going to actually add it. We're just going to ignore that. And then we can run those tests, verify they work. It does work. And then we run our coverage. Run the report. And then you see now we have 100%. And we had one of these numbers at the end are the number of times that each line was ran. So we see we ran this line twice to check this conditional. It went into this condition once and this condition once.
Some other useful functions. There's a as data frame method for the coverage object, which will output as a data frame. You can see the value is exactly sort of the same data that we had in our report. It also can aggregate by function. So there's an argument to the print method. So you print. So by default it groups by file, which isn't very useful in this case because we only have one file. But you can also group by function. And this will then group the percentages by function. So you can see that we had two functions, both of which are covered 100% in this case.
It is, I should also mention, it is possible to run covr without a formal package. So if we keep our hello.r file, but now make a test file that simply is running our code. I'll call this test demo. There's a file coverage function that simply takes a vector of file names that define functions and that run functions. So we'll make our hello.r file, which is the file that's defining all of our functions. And our new test.r file that simply runs the functions. Then the result we get is exactly like that, which you would get from a package. We can see again we only ran add even with an even number, so we don't have any coverage for this odd case. So this is a way to use covr without a formal package.
Demo with the tidyr package
For a more complicated example, we'll open the tidyr package written by Hadley. We'll load covr. Again, we can use the default print method of cov on the coverage object, and that will aggregate the results by file name. We can also group by function, and this will, for every function defined in the package, give you the coverage of that function. So this is an easy way to see exactly which functions are missing coverage.
You can also run a report on the file, which takes a little bit longer because this is a more complicated package. In this case, you can also sort each of these columns sortable, so you can sort by the number of missed lines. You can see there's a number of missed lines in the melt CPP file, and you can see in this case, here's a good candidate for additional tests. These other cases were checked, but this case was not. And since this is a little bit more complicated logic, it's probably useful to check it.
Another thing we can do is, I mentioned that covr supports not only test coverage, but also example coverage. So if you run type equals example, it will run all of the code in your examples and generate coverage that way. And then if we print this, grouping by function, we can see exactly which functions don't have examples. So the crossing function, for instance, doesn't have any examples written for it. Again, you can do a report, same fashion. Looks exactly like it would with the tests. You're just running a different set of code on your package.
We can see exactly which functions are ran by your examples. Similarly, you can do the same thing with your vignette. We'll spin the vignettes to generate a R script and then run that R script. We can see exactly which files or functions are included in the vignette. So this is a good way to see if there's portions of your package that maybe you need additional long form vignettes for.
One last thing I should mention is DevTools also has a use Travis function, which will set up Travis for your package and tell you what additional steps you need to get it working. So if you have a package on GitHub and you would like to use Travis CI for every time you push a change to the package, which I would encourage, use Travis. And there's also a use coverage function that you can use to set up coverage for the package. And it will tell you exactly the steps needed to get coverage, to get the badge on your README and all of that. So those are two functions I'd recommend.
CodeCov and Coveralls services
So see how this looks on GitHub. You may have seen these badges. So this is a CodeCov badge. And so the way that these are actually signifying that the package is using covr to generate its coverage, we can click on that. And it will take us to the CodeCov.io website. This first plot is showing the coverage over time. So we see coverage of this package is very steady over the last six months, right around 92%.
We can then drill down into exactly which files do and do not have coverage. So we see in the R files, this extract numeric function doesn't have coverage. In this case, I think it's actually okay. This is now a deprecated function, so we probably don't need to add additional tests. And that's one important thing to note, is just because a package doesn't have 100% coverage doesn't necessarily mean one that does is definitely a better solution.
Just because a package has tests that run the code doesn't mean it handles all of the possible inputs. So there could definitely be bugs in a package, even if it has 100% test coverage. We can see this works for compiled code as well. Again, we can go to our Melt C++ function, or actually C function, and see exactly the same thing we saw interactively.
So this is also a nice way for users to sort of gauge which package they'd like to use. You see tidyr has 92% coverage. That's a pretty good indicator that it's a robust package and likely won't have tons of... you won't run into many bugs with the package. It's just another way, another metric someone could use.
If you don't typically go to GitHub to look at packages, one nice thing is on the package landing page on CRAN's website, if you click the readme, and the package uses one of the coverage badges, you can see the coverage badge directly in the readme, and then click on it to take you to the CodeCov website.
One other nice feature about CodeCov is it has an extension for Chrome that integrates with GitHub. And if a package is using the CodeCov website service to track coverage, it will automatically annotate the package code with the coverage for you. So you can easily see, oh, there's only 70% coverage in the utilities function, and it will also highlight the code for you. So I can see exactly, just when I'm browsing GitHub, exactly where I'm missing coverage. So this is also one of the reasons I prefer using CodeCov on my own projects, is for this extension and some additional features that it provides over the CoverAll service.
For an example of the CoverAll service, here's a package by Dean Attali. He's using CoverAll, so if we look at his... repo on GitHub, it looks very similar to how it looks with the CodeCov, only the link takes you to the CoverAll service instead. And this is also very similar to the interactive report. So you can see all the files in the package. You can click on one, see exactly which function doesn't have test coverage. In this case, it's the printing function.
Both services are very featureful and useful, and I would encourage you to use whichever one you personally prefer. They're both fully supported by the covr package.
Adoption and community
So sort of one last conclusion is, are people actually using this package in our ecosystem? So the covr package. So this graph is showing the number of packages and repositories, package repositories on GitHub that are using Travis as well as covr with either CodeCov or the CoverAll service. So you can see from the first sort of release of when I started writing this package to today, there's well over 1,500 packages between the two services that are using covr underneath to do code coverage for R.
Bioconductor packages, their Bioconductor organization runs covr as part of their nightly build process. And so we have coverage of every package with testing on Bioconductor with the CodeCov service. And they also have these nice badges on their package landing pages. So we can see the Sunrise Experiment package, for example, has 70% test coverage.
So again, this is the number of repositories on CRAN. So there's over 1,500 repositories, GitHub packages on GitHub using this. Like I said, Bioconductor is running this on all of their 1,000 packages. And so I think it's... And then there's multiple... There's, I'm sure, a number of additional package authors who are not using one of the services on GitHub but are using covr interactively. So there's a large number of packages using this.
And this is just the same plot broken down by service. So originally, I only had support for the Coverall service in the covr package. Now there's also support for CodeCov, and that seems to be a very popular option. And like I said, I prefer using CodeCov for my own packages.
CodeCover is also the focus of the CodeCover's working group. These are the current members of the working group. And if anyone is interested in joining it, you're welcome to do so. Primarily, the working group has been focused on sort of bug fixes found in enterprise use as well as sort of using covr more in an enterprise setting such as integration with Jenkins.
Future work and conclusion
So some future work is branch coverage. So that's coverage sort of tallying by conditional statements for each conditional if all the branches are covered. The Intel compiler, so right now there's support for GCC and Clang but not for the Intel because it uses a different mechanism for tracking and reporting on coverage. Solaris Spark system and AIX support. Right now we only support Windows, macOS, and Linux. And if you're interested in the CodeCover's working group or additional features for covr, I'd encourage you to join the working group. There's more information at this wiki page.
And sort of in conclusion, these are all the sort of useful functions I think can be used to make your package, to work with coverage in your package and track coverage. Sort of the most important of which I think are the package coverage functions, the DevTools functions to set up coverage and testing in your package, the report function to generate the interactive reports.
Some common questions I get about covr are support for using on Jenkins. So there is now at least some support for doing that. There's a Coberta plugin on Jenkins for code coverage in Java, and we have support in covr to generate XML files in that format. So you can use that to integrate with the plugin and generate test coverage reports in your Jenkins instance.
Some other common questions are using coverage and testing with Shiny apps. I think that's still an ongoing area of research or an experimentation within RStudio. Shiny apps, because they are interactive, are a little more difficult to test than other R code. So once the story of testing in Shiny is more concretely understood, covr should work in a similar way. It should work just as well. The tricky part is getting the Shiny side of things working. But that's definitely something we're interested in exploring further.
In terms of additional setup, another question that's commonly asked is additional setup requirements for the compiled code. You basically shouldn't have to do anything additional if your R package has compiled code. It should automatically work. Automatically detect that you're using compiled code and provide the necessary arguments. So you won't actually have to do any additional setup. That should just work out of the box.
With that, I think I will thank everyone for watching this webinar. It unfortunately had to be re-recorded from the original webinar because the original recording did not work. Thank you for bearing with us. If you have any issues with the covr package, I highly encourage you to open an issue on the GitHub repository. Simply my name, jimhester covr issues on github.com is the issue URL. With that, thank you for listening. Hope you test your package and use coverage in the future.