
Tareef Kawaf | Posit useR! 2017 Presentation, Brussels
What has Posit been up to?
image: thumbnail.jpg
Transcript#
This transcript was generated automatically and may contain errors.
My name is Tareef Kawaf, I'm president of RStudio, and I do this probably once a year at useR! just to give people a chance to give people an update on what we've been up to, and then, frankly, hopefully get some questions and have some dialogue. There's a lot to cover, so I'm going to try and run through things pretty quickly. This particular conference was interesting because I ended up with a whole bunch of conversations that highlighted that maybe we need to spend a little more time talking about who we are and what we do, which is not something that I was planning on, but anyway, so this is our mission. It's pretty straightforward.
It's aspirational, obviously, and as you can see by the name of the company, we're very much dedicated to R. We think that R is a fantastic ecosystem, and we want to make sure that that continues to be a free and open source solution that's available to people regardless of their economic means.
So when you look at how we think about the world, we believe that all the work that you do should be reproducible, and that invariably ends up meaning that we believe that it should be in code.
So we believe in APIs, designing good APIs, trying to figure out what are the ways that make it really easy for the data scientists to get their work done.
RStudio's open source commitment
So 70% of the engineering that we do goes into open source software, and I'll walk you guys through some of the things that we've done, and then... And our plan for... Actually, JJ and I met about four and a half years ago, and our plan from day one was to say, okay, in order for this to really work, we need to have a structure, a company that is able to generate enough revenue so that we can hire the top minds so that they can, you know, top engineers that can actually work on solving these problems, right?
And so the company itself structurally is designed to make that happen, and so what we decided to do is we built these commercial products. We take our server products, and we add features and capabilities around them that really are about enterprise fit.
So, like, larger organizations that are already spending a lot of money on IT can go and say, okay, great, if I'm counting on R and I'm counting on Shiny or I'm counting on RStudio, I have a way to be able to sort of call somebody, but more importantly maybe is make sure that everything plugs into what I would expect it to plug into within my existing infrastructure. So we put a lot of features around security, authentication, monitoring, tuning, scaling, metrics, high availability, low balancing, et cetera, these kinds of things.
So those of you in the audience who are our customers, thank you very much. The rest of the slides and a lot of the slides I'm going to show you here are only possible because you guys are buying our commercial products.
Hiring and the Tidyverse
First thing I wanted to highlight is we in the last year have actually been able to hire a bunch of talent that can be dedicated to improving R, right, whether it's in the Tidyverse side of the world. Or engineers on the Shiny team or, frankly, you guys, those of you who were here yesterday could hear Minay talk, making sure that we're investing more in education and outreach within the community.
RStudio IDE updates
How many people here know about the Tidyverse? Okay, so good. I'm not going to explain it.
So how many people are on the IDE 1.0 or later? Okay, those of you who are not on there, I would recommend that you take a look at it. There's all kinds of features around notebooks, data import. There's a new profiling tool in there. How many people know about the profiler being there? Oh, okay. That's something for you to discover. So if you have slow code and you want to try and figure out why it's slow, we've tried to make life easier for you in that sense.
Spark and sparklyr
The other thing that we did, we announced this last year, but I'm guessing in this trip I found out that not all the people know about this, is there's this thing called Spark, the distributed computing engine. Lots of hype. And we were hearing from people like, oh, it doesn't work so well with R. We have to use Python. So what we ended up doing is investing in both creating a package called sparklyr and in improving the IDE so that the integration is better. And obviously a ton of time in testing and finding all the edge cases and the things that don't work in Spark and the things that don't work properly in sparklyr, et cetera.
So the idea now is if you guys are interested, I'll have some links at the end, you can go in and you can get yourself comfortable with R connecting to Spark and leveraging the power of Spark without having to give up on R.
you can go in and you can get yourself comfortable with R connecting to Spark and leveraging the power of Spark without having to give up on R.
New packages and Shiny
And then here are the packages. The packages I listed here are all packages that were updated or created in the last year. The ones that are highlighted, the blog down is in this color because it's not on CRAN yet.
So on the Shiny side, we got to 1.0. I should mention we were on 1.0 on the IDE. We're on 1.0 on Shiny. Obviously upgrades to Shiny server itself. There's a couple new packages that we're working on that are not on CRAN yet. One is Shiny test. And so one of the big things is people create Shiny applications and then the organization says, hey, you broke it when you did X or Y or Z.
We recognize that because the background of our community is data scientists, right? They're not software engineers by training. And the tooling is not that great. We're trying to create tooling that makes life easier for folks. And my colleague Barbara talked about pools, so I won't cover that too much.
R Markdown and Bookdown
R Markdown, there's a new format called Bookdown. How many people have heard of Bookdown? Okay, so Bookdown is a format that makes it easy for you to write books in it. We'll show you the website that you guys can go to and take a look at it and play with it.
And how many people are familiar with parameterized reports? Okay. Okay, that's what I expected. So parameterized reports are, you know, you guys are familiar with R Markdown docs. You can write R Markdown docs. You can actually pass in parameters. If you write your R Markdown doc in a certain way, you can have something in the YAML file that specifies what the parameters are. And then you could render the doc by passing it in the arguments and use those arguments within the report. That allows you to sort of essentially personalize a report if you want to or reuse the core logic for, you know, something like, okay, I might run the same report but for this different date range or run the same report but for North America versus South America, whatever, right?
Books, webinars, and the RStudio conference
All right, we published a new book, R for Data Science. And when I say we, I don't mean me. I mean Garrett and Hadley. And you can, if you don't have, are you guys familiar with it? All right, so there's a, you can read it online for free. You can obviously buy it too. We also have a book on Bookdown. If you go to bookdown.org, you'll actually see that not only is there a book on Bookdown, but there are, you know, the R for Data Science book is also on there as well as other people who have published books on there.
We continue to have webinars. We have cheat sheets. I think I know that people are seeing the cheat sheets. And we had our first RStudio conference in January of this year. The next one is going to be at the end of January, early February. We had a wonderful time. About 400 people managed to show up. And so if you guys are available at the end of January, early February, you're obviously more than welcome to come along.
RStudio Connect
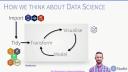
All right, so how we think about data science. You guys may have seen this before. You know, you import data, you tidy the data, you transform the data, you visualize the data, you model the data, and you keep going. And then eventually the key thing behind doing all data analysis is to communicate, right?
All right, so we decided to build a product based on feedback that we got from customers. And just to be clear, this product is a professional product. And right now it's only available on premise, but ultimately in time we imagine that we will have a cloud-based solution that everybody in the community can sort of leverage if they want to, right? And what this product is aimed at is making it really easy to go from an analysis to being able to sort of share that with the rest of the world. So it's push, button, deploy of all the artifacts that you sort of create out of R. It's an on-premise solution because most of our company customers will not run any of their stuff outside of their firewalls.
And so, again, if you want to think about it, you've got, you know, you guys are the creators of analyses. You may create notebooks, you have static docs, you have presentations, you may have parameterized R Markdown docs, as I said earlier, you can have shiny applications. And ultimately your goal is to communicate this to somebody, right? Somebody in the organization needs to be able to see this, and so we're trying to also build in things like, you know, scheduling. So if you wanted a report to run every Monday and email people out or whatever, you can sort of do things like that without having to sort of write your own crontabs or, you know, have a separate system call into it.
Now if you want to, you can absolutely do the same thing. The foundation of everything that you see here is all open source, right? People can recreate this themselves at any point in time, and I expect that they will.
In terms of, so again, the creators, there's artifacts, there's consumers, and you guys are all familiar with the work of the creator, right? So you're tidying that whole tidy, transform, visualize model, but you also care about reproducibility, you care about collaboration, you care about publishing, you care about protecting, right? So who can see this content, when can they see it, and so on and so forth, right? And then on the consumer side, they want to be able to get a hold of the data, they want to be able to explore the data, they may want to personalize it, say, I'm only interested in reports about North America, or I'm only interested in Southern Italy, right?
Or they may want to say, I know I saw, you know, Joe showed me a report or a dashboard, I want to see what that looks like today, can I go back and rerun that myself, right? So the idea is if you've already built this logic in R, we're going to try and make it more and more accessible to the business user.
All right, so that's what Connect does. And, you know, a lot of our work ends up being providing features to answer questions for the IT organization on why R, right? The data scientists are bought in, they use it, they're building really great things, and then they run into these obstacles within the IT organization. So, you know, we spend a lot of time trying to say, okay, you know what, here's how you tune this, here's how you monitor this, here's how you scale it.
For Connect, for example, I just spent a pile of cash on an external security vendor firm to come in and validate and make sure that, hey, you know what, here are the issues that we found, that there's an independent person taking a look at that. And so we have a higher bar to cross over because, you know, for IT, they're very familiar with a Python solution, a Python stack, and in many ways they ask the data scientists on the R side to hold themselves to a higher standard than what, you know, what even the rest of the organization is held to.
But our job is to hopefully make it easier and easier for that sell to happen. So deployment is a push-button deployment. We identify dependencies, you know, we use Packer right underneath the hood. We match up our versions to the best of our abilities, and so the idea is get more of these artifacts to be published quickly.
The reports, all the reporting is based on our markdown, so it's completely reproducible. You can schedule it, you can email it, you know, ultimately in time, you can imagine that you can also have that drop into a location on disk or drop into Confluence, or potentially, like, send a Slack message or whatever, right? And you can customize, you can give the end user the opportunity to sort of customize the report that they see based on the parameters that they're interested in. And obviously, it can do everything around hosting Shiny applications.
So generally, architecturally, this is what it looks like. You know, you've got the data scientist publishing on one side, you've got the end user sort of interacting with it as a web browser. They don't know that they're talking to anything that is R-related.
Useful websites and resources
So useful websites, shiny.rstudio.com, I'm guessing everybody here knows about it. rmarkdown.rstudio.com, everybody? Yes? No? Kind of? All right. You guys are falling asleep on me. db.rstudio.com is a new website. It's talking about, like, we're trying to capture all the things that are related to sort of connecting from R to the database. spark.rstudio.com is the same kind of thing, but for Spark. Bookdown, we've talked about a little bit. And if you wanted to play with Connect, you can, without downloading it, there's an eval that you can download and run it, but if you wanted to just play with it and see what the end user experience is like, there's all the features, because it's a common shared infrastructure, but it'll give you a feel for, like, what you can publish, how you can schedule, et cetera. So you can go to beta.rstudio.com and just log in with your Google Auth.
All right, so with that, how many minutes do I have? Two and a half minutes. Questions? Concerns? Nothing? I can't actually see if there are any hands up. All right. That's it. That's all I had. Thanks, guys.