You’ve made it to third part of “The Shiny Side of LLMs” series, where we turn everything we’ve learned into something real and interactive! Our weapon of choice: Shiny, of course.
In the first part, What LLMs Actually Do (and What They Don’t)
, we explored what LLMs actually do. We covered how they generate text, what they’re good (and bad) at, and we covered most of the jargon that gets thrown around. Then in part two, Talking to LLMs: From Prompt to Response
, we got practical. You learned how to structure prompts, send them to a model via an API using chatlas
or ellmer
, and handle the responses in your code. Now it’s time to wrap that logic in an interface your users can love and can actually interact with!
In this post, we’ll cover how to:
- Structure a basic Shiny app (in both Python and R) with a user interface (UI) and reactive server logic
- Connect user input to an LLM call and show the result in the UI
- Set up a chat interface
- Keep your app responsive while doing lengthy tasks or calculations (yes, a quick guide to async programming!)
- Add UI polish like pretty looking value boxes, loading indicators, and error messages
- Bonus: deploy your app with a single click to Posit Connect (Cloud) or shinyapps.io
By the end of this part, you’ll have your first real, working, LLM-powered app. And most importantly: the knowledge to build many more.
What are we going to do in this last part?
This part of “The Shiny Side of LLMs” series will build an app called “DeckCheck”: a genius app that gets rid of lengthy unfocused presentations, like a perfect “Presentation Rehearsal Buddy”. The goal: let users upload their Quarto
presentation and provide them with feedback on how to make it better.
No time for the walkthrough?
Want to dive straight into the full app? Head over to the end result
.
Why Shiny?#
We knew pretty early on that “DeckCheck” was going to be an app. Why? Because an app is just easier. People can click buttons, type things, and get results without ever touching code (which is great, because “copy-paste this into your terminal” tends to scare off half the audience).
But ok, why Shiny? You’re reading this on the Shiny blog, so yes, it seems pretty obvious we love it. Still, we have solid reasons:
- You can go from idea to something you can actually click in almost no time. Shiny is great for prototyping. You can quickly experiment, gather feedback, and gradually build an app out to a production-ready state.
- Shiny is reactive by design, which is a fancy way of saying: it keeps track of what depends on what, and only updates what actually needs to change. You don’t need to worry about the logic, which means you can spend more time building your app instead of dealing with state management.
- This reactive engine also makes Shiny efficient: outputs only re-render when the stuff they depend on changes.
- If your LLM workflow is in Python, there’s Shiny for Python. If it’s in R, there’s Shiny for R. No language wars or conversations about “X is better than Y”. Just pick whatever you’re comfortable with.
- You can even drop in your own HTML, CSS, and JavaScript to really make it your own.
Alright, enough with the sales pitch. Shiny it is!
How Shiny Assistant assists you
Fun fact: this article contains side-by-side examples in both Python and R. To showcase how Shiny Assistant
can support you in either language, it was used to generate some of the conversions. That’s a neat way to highlight how an LLM can help you get started with Shiny! The true “Shiny Side of LLMs”. Of course result were not always 100% spot on, but luckily there was still a human in the loop.
Optimising conversations for Shiny#
Getting your API key
Remember you need to grab an API key for your chosen LLM provider
. You need this key to authenticate. Store this key as an environment variable. For example, to use Claude from Anthropic, ANTHROPIC_API_KEY=yourkey needs to be in .Renviron or .env file.
Going from a script-like workflow to an app requires a different way of thinking. We simply have other expectations from a web app compared to just a regular Python or R script. We want things to be interactive, and ideally we want to have the result instantly. If we click on something, we expect something to happen, fast. Ever encountered a web page that stayed blank for just 5 seconds? How long did that feel? Like 10 minutes? Or didn’t you even stick out the 5 seconds? Yes, you are impatient! You need to see something is happening, and get some visual feedback.
LLMs take your impatience into account, and that’s why most models stream tokens progressively. Instead of making you wait forever for a big wall of text, they start showing you the answer bit by bit, almost like they’re thinking out loud. This streaming feels faster, keeps you engaged, and makes the whole experience way less frustrating. chatlas and ellmer use this streaming capability too and they print the result on the console as soon as words come in. But… a Shiny app doesn’t have a console! So what to do?
Where the chat() method does not return any results until the entire response is received and only prints the streaming results to the console, the stream() method can process the response as it arrives. It’s perfect for something like a Shiny chat window. You simply replace the chat() method with the stream() method, which returns something called a “generator”. A generator is a function that can pause (yield) and resume later, remembering where it left off. That’s handy because it lets your code:
- Process text as it arrives (aka, by chunk) instead of waiting for the whole thing.
- Pause between chunks without blocking other things.
- Keep its place so it can pick up right where it left off when the next chunk arrives.
Python#
In the chatlas documentation you can read more about streams
.
 1
 2
 3
 4
 5
 6
 7
 8
 9
10
11
12
13
14
15
16
17
18
19
20
21
22
23
24
25
26
27
28
29
30
|
from chatlas import ChatAnthropic

chat = ChatAnthropic(
    model="claude-sonnet-4-20250514",
    system_prompt="You are a presentation coach for data scientists. You give constructive, focused, and practical feedback on titles, structure, and storytelling.",
)

# Set model parameters (optional)
chat.set_model_params(
    temperature=0.8,  # default is 1
)

stream = chat.stream(
    """I'm working on a presentation with the title: 'The Shiny Side of LLMs'.
        Please evaluate the clarity, tone, and relevance of this title for the intended audience.
        For context, this is a 10-minute lightning talk at posit::conf(2025).
        The audience is Python and R users who are curious about AI and large language models,
        but not all of them have a deep technical background.

        The talk uses Shiny as a way to explore and demo LLMs in practice.

        Return your answer as a JSON array of objects, where each object has the following keys:

        - 'aspect': one of 'clarity', 'tone', or 'relevance'
        - 'feedback': your concise assessment
        - 'suggestion': an optional improvement if applicable"""
)

for chunk in stream:
    print(chunk)
|
The object that gets returned by the stream()
method is a generator
.
In the ellmer documentation you can read more about streaming
.
 1
 2
 3
 4
 5
 6
 7
 8
 9
10
11
12
13
14
15
16
17
18
19
20
21
22
23
24
25
26
27
28
29
30
31
32
|
library(ellmer)

chat <- chat_anthropic(
  model = "claude-sonnet-4-20250514",
  system_prompt = "You are a presentation coach for data scientists.
  You give constructive, focused, and practical feedback on titles, structure, and storytelling.",
  params = params(
    temperature = 0.8 # default is 1
  )
)

stream <- chat$stream(
  "I'm working on a presentation with the title: 'The Shiny Side of LLMs'.
Please evaluate the clarity, tone, and relevance of this title for the intended audience.
For context, this is a 10-minute lightning talk at posit::conf(2025).
The audience is Python and R users who are curious about AI and large language models,
but not all of them have a deep technical background.

The talk uses Shiny as a way to explore and demo LLMs in practice.

Return your answer as a JSON array of objects, where each object has the following keys:

- 'aspect': one of 'clarity', 'tone', or 'relevance'
- 'feedback': your concise assessment
- 'suggestion': an optional improvement if applicable"
)

coro::loop(
  for (chunk in stream) {
    cat(chunk)
  }
)
|
The object that gets returned by the stream()
method is a coro generator
.
Streaming is great for things like chatbots, live transcription, or anything where seeing text appear in real time feels natural. It’s perfect for conversations, or when the answer is long and you don’t want to keep users staring at a blank screen.
In apps like “DeckCheck”, where we’re analysing a Quarto presentation behind the scenes and then showing a finished result, streaming doesn’t really add much. Users expect a clear, polished answer all at once. Not a JSON, but ready-to-go value boxes, graphs and tables. So in this case, a smooth loading indicator or progress bar will probably satisfy impatient users and we can stick to our chat() method. Don’t forget the stream() method though: we’ll use that a little bit later in a small demo chatbot.
Whether we’re streaming or not, users simply have to wait for an LLM response and you can keep them entertained while they’re doing that. But another important thing related to a long waiting time is when your app is used by multiple users at the same time. They might ask things from the model at the same time too, meaning that you’re dealing with concurrent chat sessions. If you would just use chat() or stream(), the Shiny app (or technically speaking: the Python or R session running the Shiny app) will be blocked for other users for the duration of each response. And that’s not cool. The more users are concurrently using your app, the longer the queue gets, and the longer users have to wait. This is synchronous behaviour. We rather deal asynchronously (aka async) with a model’s responses. It means that we can receive responses at the same time, in parallel. To use async chat, we need to call chat_async() / stream_async() instead of chat() / stream(). The _async variants take the same arguments but returns a coroutine object, (aka a placeholder for something that will come) instead of the actual response.
So ideally, asking a question to an LLM would look something like this in our Shiny application:
Python#
Note for Positron/Jupyter users
Positron and Jupyter already run their own event loop, so asyncio.run(main()) will fail with a runtime error. Instead of wrapping in asyncio.run, you can just do: await main() at the top level.
 1
 2
 3
 4
 5
 6
 7
 8
 9
10
11
12
13
14
15
16
17
18
19
20
21
22
23
24
25
26
27
|
import asyncio
from chatlas import ChatAnthropic

chat = ChatAnthropic(
    model="claude-sonnet-4-20250514",
    system_prompt="You are a presentation coach for data scientists. You give constructive, focused, and practical feedback on titles, structure, and storytelling.",
)

async def main():
    response = await chat.chat_async(
        """I'm working on a presentation with the title: 'The Shiny Side of LLMs'.
        Please evaluate the clarity, tone, and relevance of this title for the intended audience.
        For context, this is a 10-minute lightning talk at posit::conf(2025).
        The audience is Python and R users who are curious about AI and large language models,
        but not all of them have a deep technical background.

        The talk uses Shiny as a way to explore and demo LLMs in practice.

        Return your answer as a JSON array of objects, where each object has the following keys:

        - 'aspect': one of 'clarity', 'tone', or 'relevance'
        - 'feedback': your concise assessment
        - 'suggestion': an optional improvement if applicable"""
    )
    print(response)

asyncio.run(main())
|
Show output
 1
 2
 3
 4
 5
 6
 7
 8
 9
10
11
12
13
14
15
16
17
18
19
20
21
22
23
24
25
26
27
28
29
30
|
"""
 [
   {
     "aspect": "clarity",
     "feedback": "The title is somewhat ambiguous - 'shiny side' could refer to positive aspects of LLMs or
 the Shiny framework itself. For an audience not deeply familiar with both topics, this creates confusion
 about the main focus.",
     "suggestion": "Consider titles like 'Exploring LLMs with Shiny' or 'Building LLM Demos in Shiny' to
 clearly establish that Shiny is your vehicle for demonstrating LLMs."
   },
   {
     "aspect": "tone",
     "feedback": "The tone is appropriately casual and engaging for a lightning talk, with a clever play on
 words that fits the conference atmosphere. However, it may be too playful for conveying the practical valu
 of the content.",
     "suggestion": "Balance the wordplay with clearer value proposition, such as 'The Shiny Side of LLMs:
 Interactive AI Exploration' to maintain engagement while signaling practical benefits."
   },
   {
     "aspect": "relevance",
     "feedback": "Highly relevant to the posit::conf audience who knows Shiny well, but the connection
 between Shiny and LLMs isn't immediately clear from the title alone. Given the 10-minute format, you need
 attendees to quickly understand the value.",
     "suggestion": "Make the connection more explicit with alternatives like 'Hands-On LLM Exploration with
 Shiny Apps' or 'From Prompts to Production: LLMs in Shiny' to immediately communicate the practical
 application."
   }
 ]
<chatlas._chat.ChatResponseAsync object at 0x111a5c560>
"""
|
chat_async()
returns a coroutine object, which is basically a special kind of function that runs asynchronously. It doesn’t do the work right away when you call it, but it gives you this object that you can later “await” to actually get the result. If you’re running regular (non-asynchronous) code, you use asyncio.run() to start and wait for the task to finish.
 1
 2
 3
 4
 5
 6
 7
 8
 9
10
11
12
13
14
15
16
17
18
19
20
21
22
23
24
|
library(ellmer)
library(promises)

chat <- chat_anthropic(
  model = "claude-sonnet-4-20250514",
  system_prompt = "You are a presentation coach for data scientists.
  You give constructive, focused, and practical feedback on titles, structure, and storytelling."
)

chat$chat_async(
  "I'm working on a presentation with the title: 'The Shiny Side of LLMs'.
Please evaluate the clarity, tone, and relevance of this title for the intended audience.
For context, this is a 10-minute lightning talk at posit::conf(2025).
The audience is Python and R users who are curious about AI and large language models,
but not all of them have a deep technical background.

The talk uses Shiny as a way to explore and demo LLMs in practice.

Return your answer as a JSON array of objects, where each object has the following keys:

- 'aspect': one of 'clarity', 'tone', or 'relevance'
- 'feedback': your concise assessment
- 'suggestion': an optional improvement if applicable"
) %...>% print()
|
Show output
1
|
#> [1] "```json\n[\n {\n \"aspect\": \"clarity\",\n \"feedback\": \"The title is somewhat ambiguous - 'shiny side' could mean positive aspects of LLMs or reference the Shiny framework. The wordplay may confuse rather than clarify the content focus.\",\n \"suggestion\": \"Consider 'Building LLM Demos with Shiny' or 'Interactive LLM Exploration Using Shiny' to clearly communicate both the tool and topic.\"\n },\n {\n \"aspect\": \"tone\",\n \"feedback\": \"The playful wordplay fits well with the lightning talk format and conference atmosphere. It's approachable and not intimidating for audiences with varying technical backgrounds.\",\n \"suggestion\": null\n },\n {\n \"aspect\": \"relevance\",\n \"feedback\": \"Highly relevant for posit::conf audience who are familiar with Shiny. The title connects a trending AI topic with a beloved R/Python tool, making LLMs accessible to the community.\",\n \"suggestion\": \"Consider adding a subtitle for context: 'The Shiny Side of LLMs: Interactive Demos for AI Exploration' to enhance relevance while keeping the clever wordplay.\"\n }\n]\n```"
|
chat_async()
starts the work and returns a promise, this special kind of placeholder. Then %...>%
attaches the next step, like printing the result, once it’s ready. This keeps your R session running without waiting or freezing. Note that it resolves to a string (probably Markdown), which is slightly different than just using the chat() method. This is also why the output looks a little bit different compared to part two of this series
.
And before you’re thinking: “hey, we were using structured output in the last part
, right?” Yes! Luckily there’s also a method called chat_structured_async() (see docs for Python
and R
). How convenient! We’ll use that a little bit later.
Chatting with an LLM via Shiny#
Never developed a Shiny app before? That’s ok! Before building our DeckCheck app, we’ll start with a very basic example that allows you to chat with any LLM, just like you type in your question at ChatGPT. And while this series isn’t about building “just a chatbot”, you can perfectly do so with Shiny. Minimal code required to get started. If you have experience with Shiny this code won’t have much surprises, but if you’re new to Shiny there’s a mini crash-course-like explanation below the code.
Python#
 1
 2
 3
 4
 5
 6
 7
 8
 9
10
11
12
13
14
15
16
17
18
19
20
21
22
23
24
25
26
27
28
29
30
31
|
from shiny import App, ui
from chatlas import ChatAnthropic

# Define UI
app_ui = ui.page_fluid(
    ui.h1("DeckCheck"),
    # Card with chat component
    ui.card(
        ui.card_header("Get started"),
        ui.p("Ask me anything about your presentation 💡"),
        # Chat component
        ui.chat_ui(id="my_chat"),
    ),
)

# Define server
def server(input, output, session):
    chat = ui.Chat(id="my_chat")

    chat_client = ChatAnthropic(
        model="claude-sonnet-4-20250514",
        system_prompt="You are a presentation coach for data scientists. You give constructive, focused, and practical feedback on titles, structure, and storytelling.",
    )

    @chat.on_user_submit
    async def handle_user_input(user_input: str):
        response = await chat_client.stream_async(user_input)
        await chat.append_message_stream(response)

# Create app
app = App(app_ui, server)
|
In the above code app_ui defines the front end of the app. It’s everything the user sees and interacts with. Here, it’s created with ui.page_fluid() and contains a heading with our app title, a ui.card() with a header (ui.card_header()) and short paragraph (ui.p()). Below, there’s a ui.chat_ui() component that serves as the chat interface. The server function controls the app’s back end and this part is responsible for how it responds to user actions. Inside this server, we first create a chat object that connects to the chat UI via its ID (the o-so original "my_chat"). Then, we create a chat_client object via chatlas.
The key part is the @chat.on_user_submit decorator. .on_user_submit lets you define a function that runs when the user hits “send” in the chat UI. This function, in our case called handle_user_input, sends the message asynchronously to the model via chat_client.stream_async() and streams the reply back into the chat UI with append_message_stream(). Under the hood, Shiny makes use of the shinychat
package.
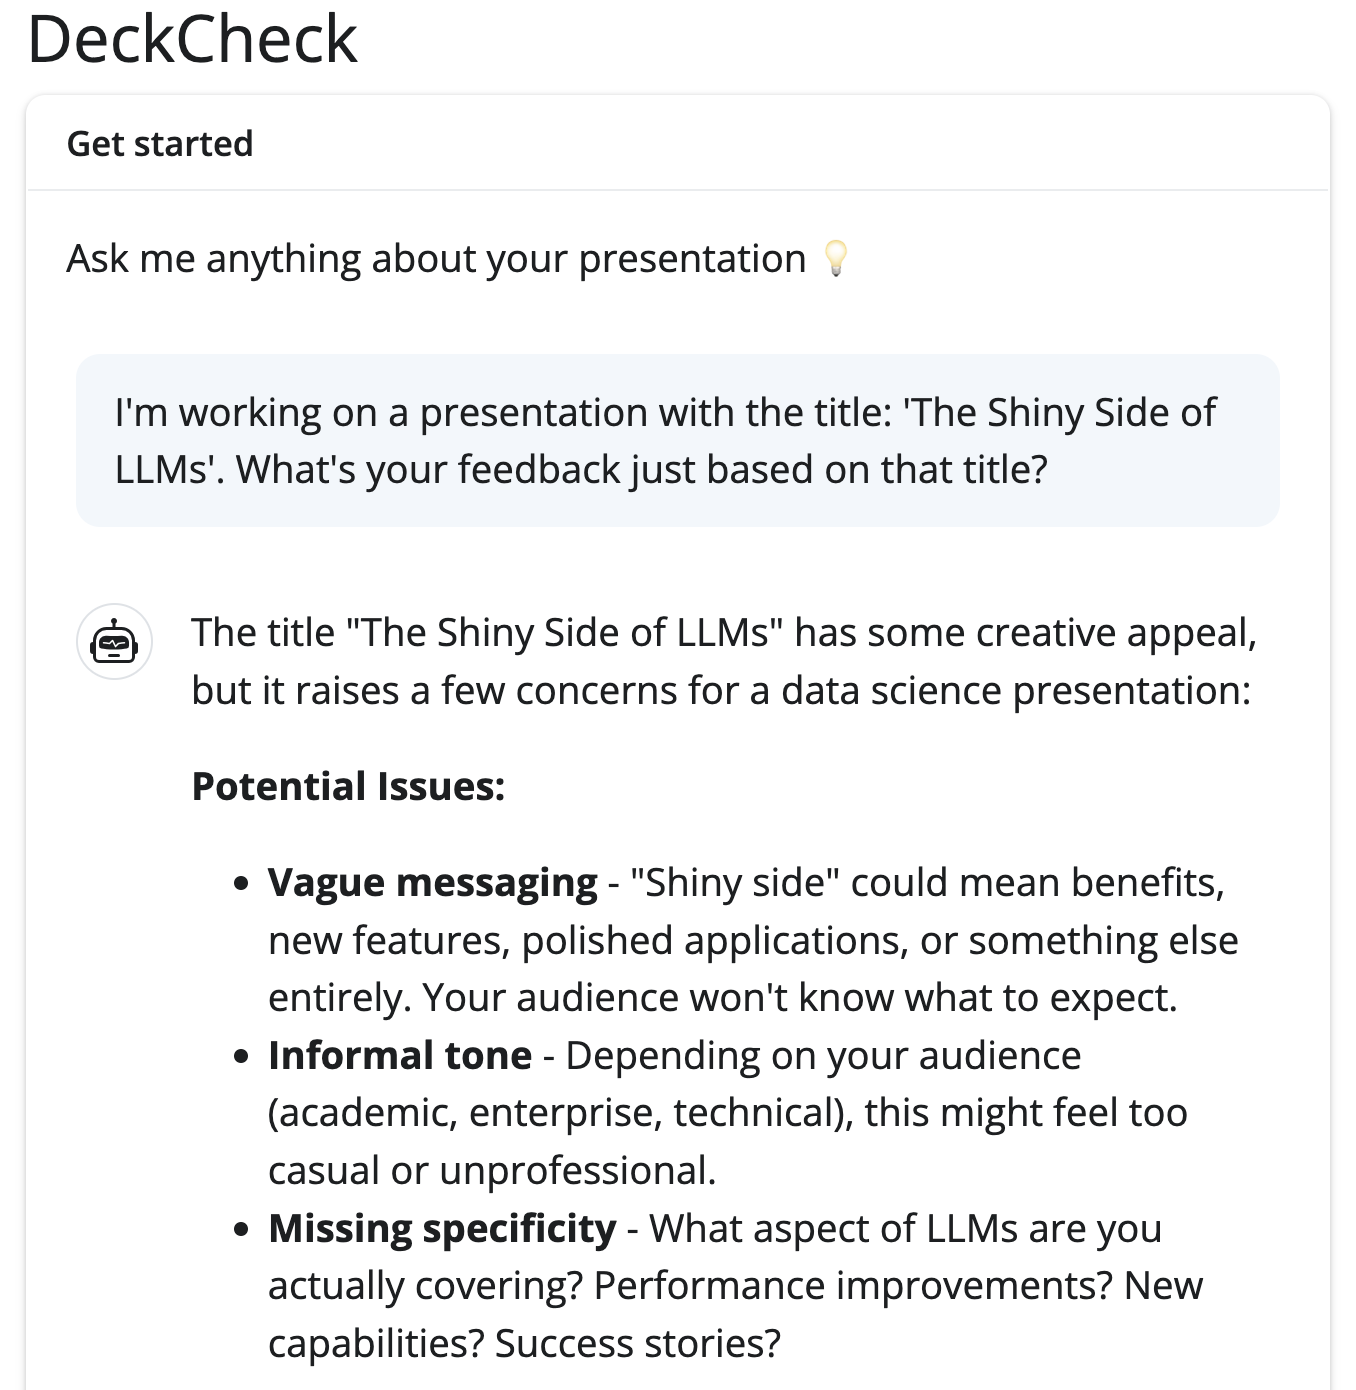
When we asks a question (e.g. our simple “I’m working on a presentation with the title: ‘The Shiny Side of LLMs’. What’s your feedback just based on that title?”) we get a nicely formatted response back:
 1
 2
 3
 4
 5
 6
 7
 8
 9
10
11
12
13
14
15
16
17
18
19
20
21
22
23
24
25
26
27
28
29
30
31
32
|
library(shiny)
library(bslib)
library(ellmer)
library(shinychat)

ui <- page_fluid(
  theme = bs_theme(bootswatch = "flatly"),

  # App title
  h1("DeckCheck"),

  # Create a card
  card(
    card_header("Get started"),
    p("Ask me anything about your presentation 💡"),

    # Chat component
    chat_mod_ui("my_chat")
  )
)

server <- function(input, output, session) {
  chat_client <- chat_anthropic(
    model = "claude-sonnet-4-20250514",
    system_prompt = "You are a presentation coach for data scientists.
  You give constructive, focused, and practical feedback on titles, structure, and storytelling."
  )

  chat_mod_server("my_chat", chat_client)
}

shinyApp(ui, server)
|
Custom streaming
If you ever wanted to build something more custom, shinychat::markdown_stream() would let you stream model output into any Shiny interface, chat or not.
In the above code, ui defines the front end of the app. It’s everything the user sees and interacts with. Here, it’s created with bslib’s page_fluid() with a “Flatly” Bootstrap theme for styling. Don’t like Flatly? There are many themes
to choose from! And if you don’t like any, you can just skip the theme argument or get started with custom CSS
.
After specifying the theme, there’s a heading with our app title, followed by a card() containing a header, a short description, and most importantly, the chat interface provided by chat_mod_ui("my_chat") from the shinychat
package.
The server function controls the app’s back end and this part is responsible for how it responds to user actions. Inside this server, we first create a chat_client object using chat_anthropic(). Then we connect this chat object to the UI with chat_mod_server("my_chat", chat_client) via its ID ("my_chat").
chat_mod_ui() and chat_mod_server() together form a Shiny module. This module handles sending user messages to the model, receiving responses, and streaming those responses back into the UI, all asynchronously. The async streaming happens “under the hood,” so you don’t have to manually manage partial chunks of text or async calls yourself.
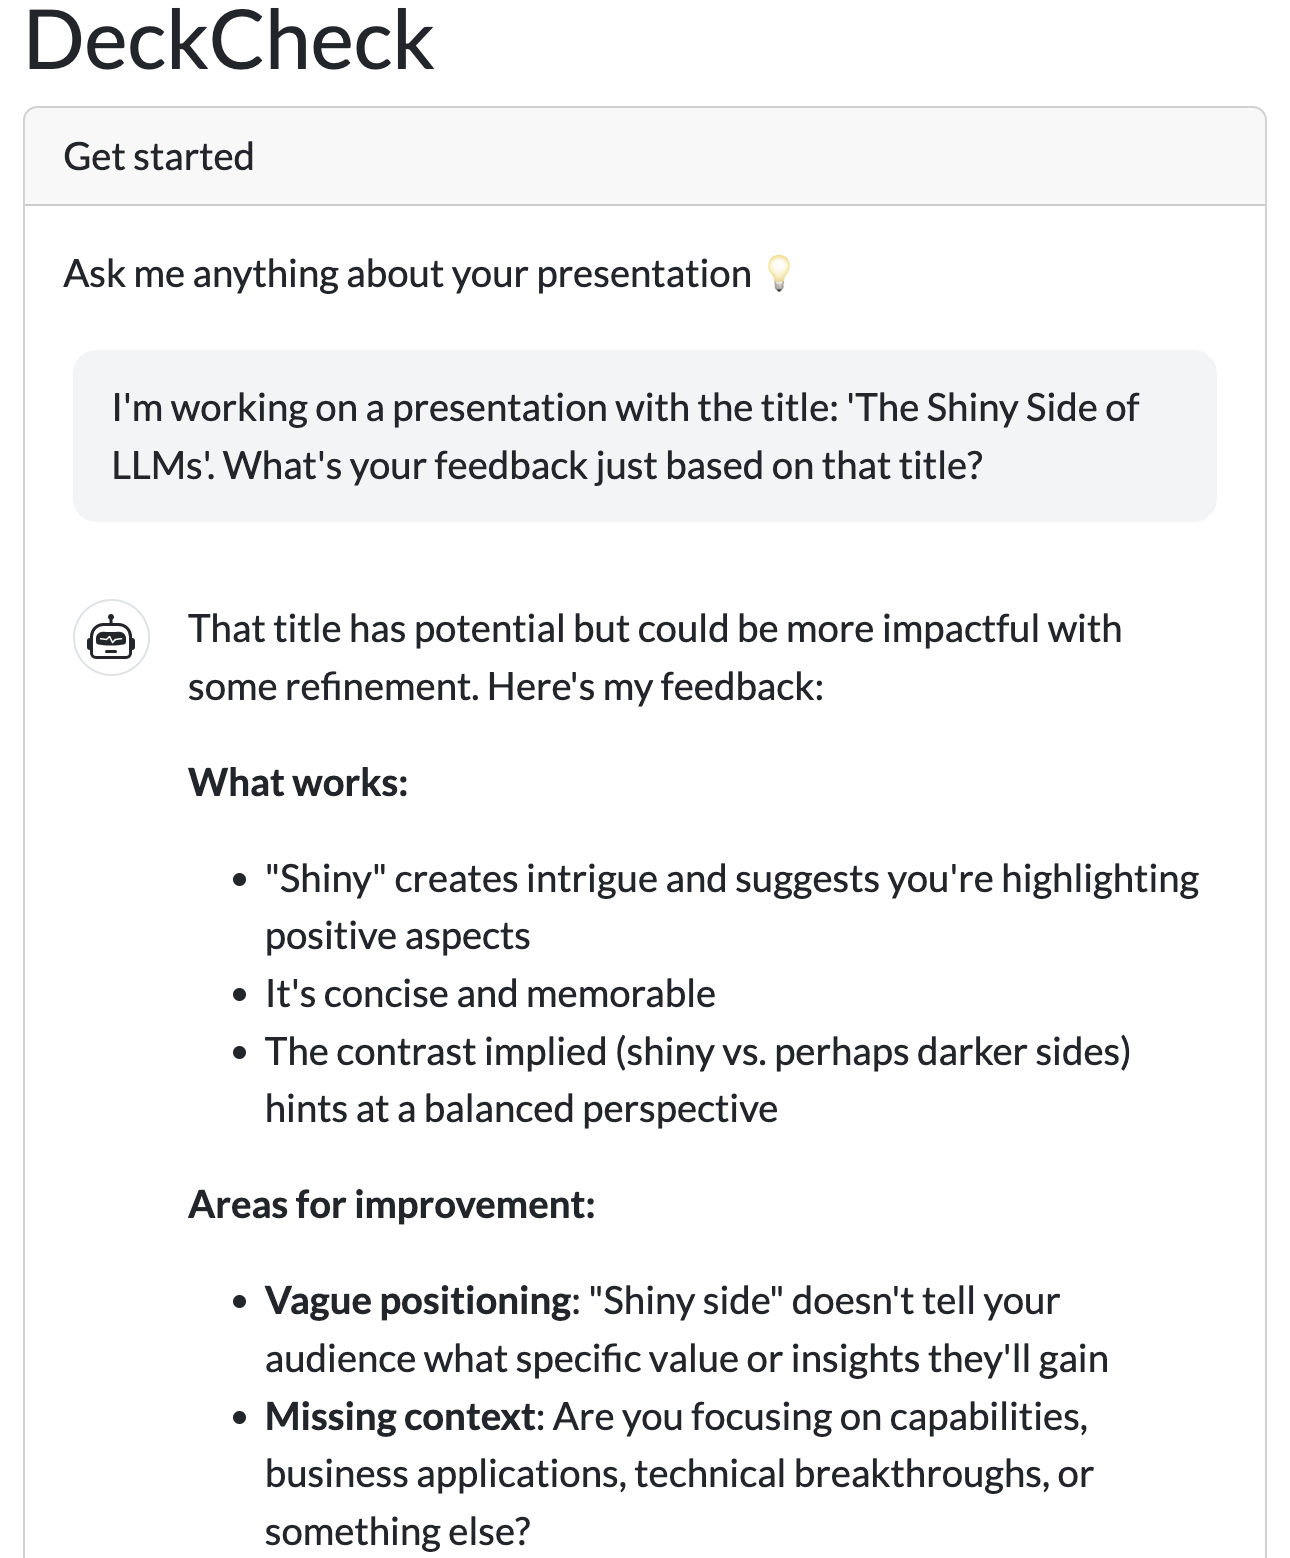
When we asks a question (e.g. our simple “I’m working on a presentation with the title: ‘The Shiny Side of LLMs’. What’s your feedback just based on that title?”) we get a nicely formatted response back:
Building DeckCheck#
All the ingredients are there now: we know how to programmatically talk to an LLM, we can make an informed choice when it comes to streaming (or not streaming) and async usage, and we’ve seen how to combine it in a simple chat interface (with a bit of help from shinychat). Time to apply that knowledge to our DeckCheck app.
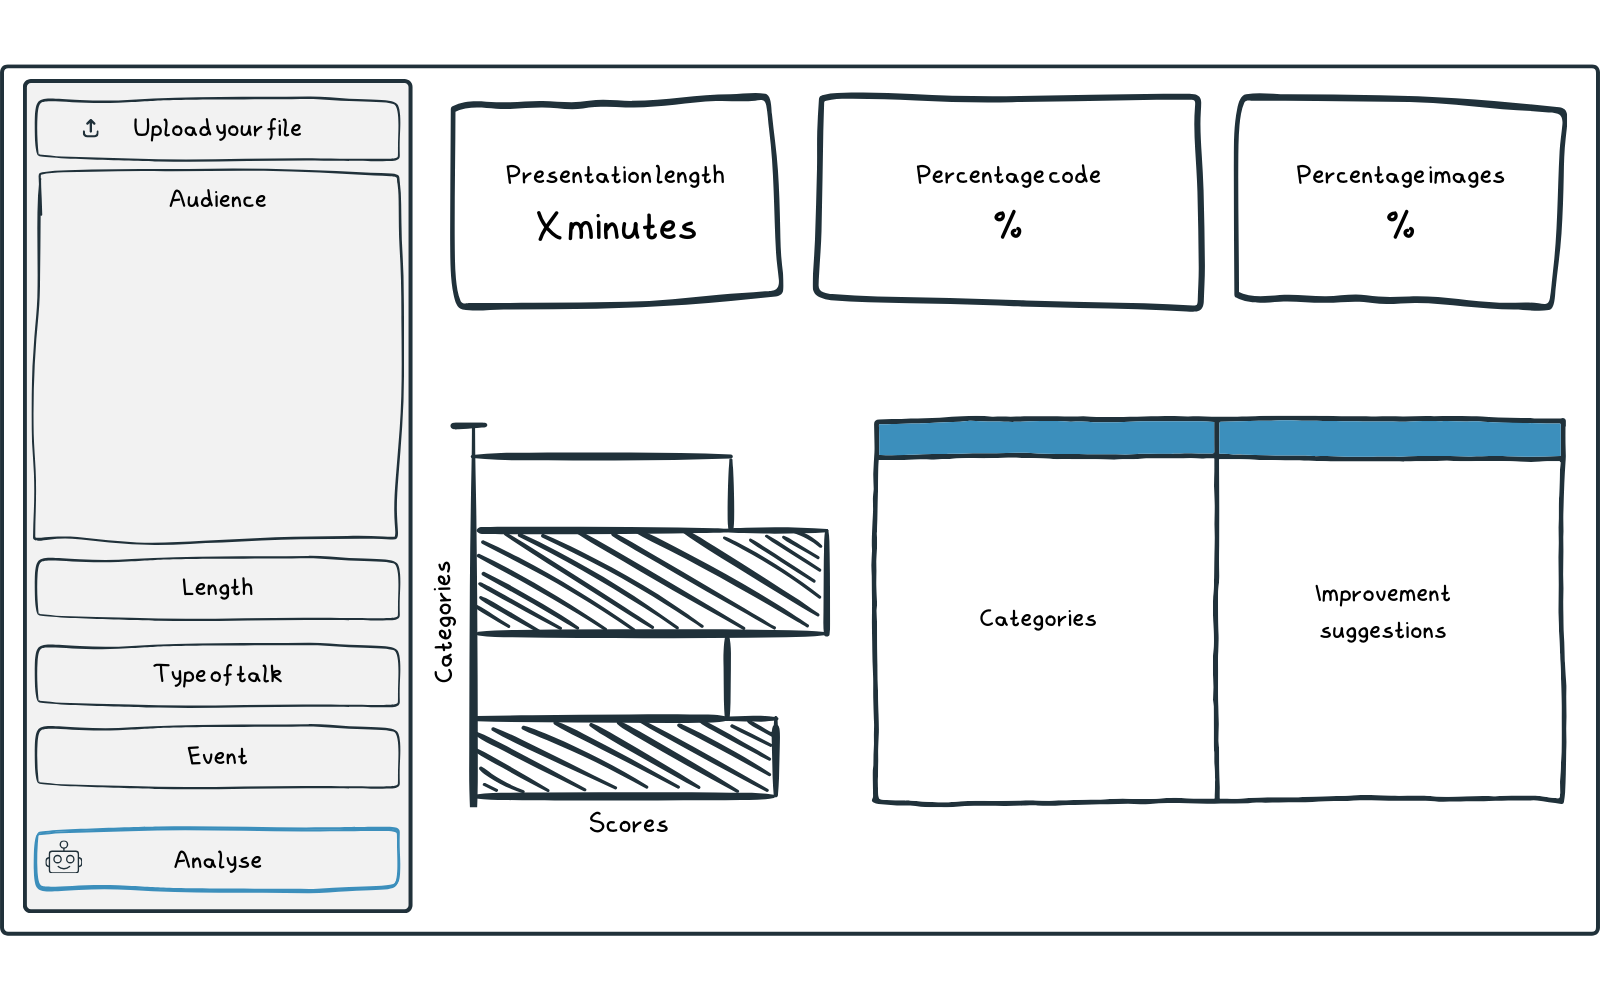
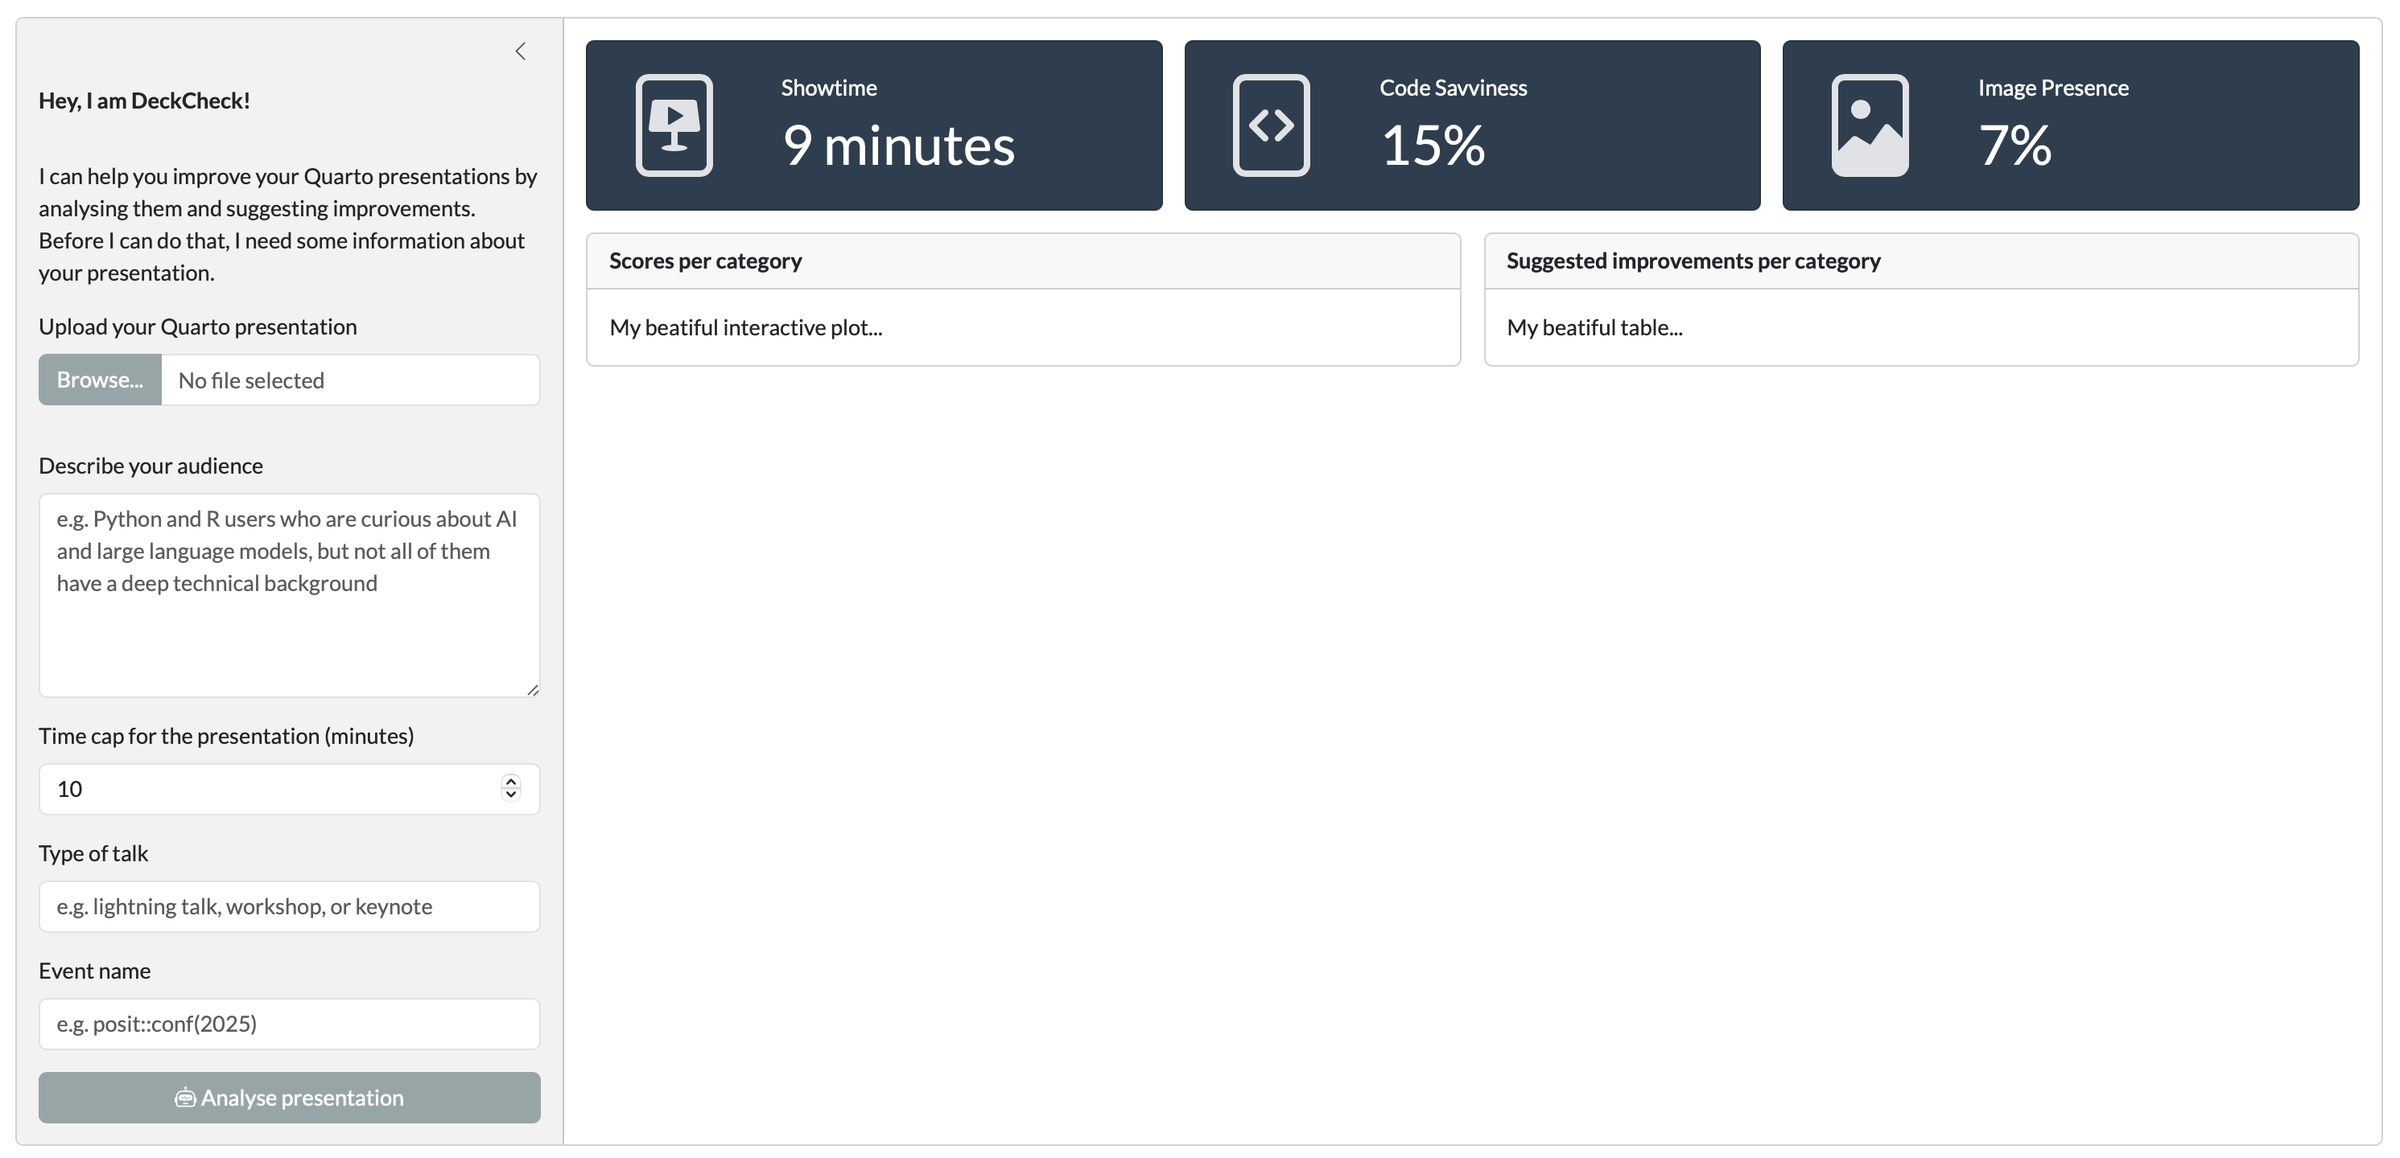
But, first things first… A design. Nothing too fancy, just a quick conceptual drawing of what our app will look like. No matter what kind of app you’re developing, this is always the (and honestly, often overlooked) first step. If you know what you’re building towards, it’s way easier to start coding. Here’s our design:
We have a section where users can upload information (most importantly, the Quarto presentation itself, but also the required information like audience), there are some value boxes, there’s a graph, and a table. Elements you will frequently encounter when developing data-savvy apps. For a reason, of course, as we want to provide you with all the necessary building blocks.
To bring this design to life, here’s what we’re working towards:
But first things first: let’s start with building the basic UI before we connect the server part to it.
Python#
  1
  2
  3
  4
  5
  6
  7
  8
  9
 10
 11
 12
 13
 14
 15
 16
 17
 18
 19
 20
 21
 22
 23
 24
 25
 26
 27
 28
 29
 30
 31
 32
 33
 34
 35
 36
 37
 38
 39
 40
 41
 42
 43
 44
 45
 46
 47
 48
 49
 50
 51
 52
 53
 54
 55
 56
 57
 58
 59
 60
 61
 62
 63
 64
 65
 66
 67
 68
 69
 70
 71
 72
 73
 74
 75
 76
 77
 78
 79
 80
 81
 82
 83
 84
 85
 86
 87
 88
 89
 90
 91
 92
 93
 94
 95
 96
 97
 98
 99
100
101
102
103
104
105
106
107
108
109
110
|
from shiny import App, ui
import shinyswatch

# ======================
# Icons
# ======================
# SVG icon copied from https://icons.getbootstrap.com/icons/file-slides-fill/
file_slides = """<svg xmlns="http://www.w3.org/2000/svg" fill="currentColor" class="bi bi-file-slides-fill" viewBox="0 0 16 16">
  <path d="M7 7.78V5.22c0-.096.106-.156.19-.106l2.13 1.279a.125.125 0 0 1 0 .214l-2.13 1.28A.125.125 0 0 1 7 7.778z"/>
  <path d="M12 0H4a2 2 0 0 0-2 2v12a2 2 0 0 0 2 2h8a2 2 0 0 0 2-2V2a2 2 0 0 0-2-2M5 4h6a.5.5 0 0 1 .496.438l.5 4A.5.5 0 0 1 11.5 9h-3v2.016c.863.055 1.5.251 1.5.484 0 .276-.895.5-2 .5s-2-.224-2-.5c0-.233.637-.429 1.5-.484V9h-3a.5.5 0 0 1-.496-.562l.5-4A.5.5 0 0 1 5 4"/>
</svg>"""

file_code = """<svg xmlns="http://www.w3.org/2000/svg" fill="currentColor" class="bi bi-file-code-fill" viewBox="0 0 16 16">
  <path d="M12 0H4a2 2 0 0 0-2 2v12a2 2 0 0 0 2 2h8a2 2 0 0 0 2-2V2a2 2 0 0 0-2-2M6.646 5.646a.5.5 0 1 1 .708.708L5.707 8l1.647 1.646a.5.5 0 0 1-.708.708l-2-2a.5.5 0 0 1 0-.708zm2.708 0 2 2a.5.5 0 0 1 0 .708l-2 2a.5.5 0 0 1-.708-.708L10.293 8 8.646 6.354a.5.5 0 1 1 .708-.708"/>
</svg>"""

file_image = """<svg xmlns="http://www.w3.org/2000/svg" fill="currentColor" class="bi bi-file-image-fill" viewBox="0 0 16 16">
  <path d="M4 0h8a2 2 0 0 1 2 2v8.293l-2.73-2.73a1 1 0 0 0-1.52.127l-1.889 2.644-1.769-1.062a1 1 0 0 0-1.222.15L2 12.292V2a2 2 0 0 1 2-2m4.002 5.5a1.5 1.5 0 1 0-3 0 1.5 1.5 0 0 0 3 0"/>
  <path d="M10.564 8.27 14 11.708V14a2 2 0 0 1-2 2H4a2 2 0 0 1-2-2v-.293l3.578-3.577 2.56 1.536 2.426-3.395z"/>
</svg>"""

robot = """<svg xmlns="http://www.w3.org/2000/svg" width="16" height="16" fill="currentColor" class="bi bi-robot" viewBox="0 0 16 16">
  <path d="M6 12.5a.5.5 0 0 1 .5-.5h3a.5.5 0 0 1 0 1h-3a.5.5 0 0 1-.5-.5M3 8.062C3 6.76 4.235 5.765 5.53 5.886a26.6 26.6 0 0 0 4.94 0C11.765 5.765 13 6.76 13 8.062v1.157a.93.93 0 0 1-.765.935c-.845.147-2.34.346-4.235.346s-3.39-.2-4.235-.346A.93.93 0 0 1 3 9.219zm4.542-.827a.25.25 0 0 0-.217.068l-.92.9a25 25 0 0 1-1.871-.183.25.25 0 0 0-.068.495c.55.076 1.232.149 2.02.193a.25.25 0 0 0 .189-.071l.754-.736.847 1.71a.25.25 0 0 0 .404.062l.932-.97a25 25 0 0 0 1.922-.188.25.25 0 0 0-.068-.495c-.538.074-1.207.145-1.98.189a.25.25 0 0 0-.166.076l-.754.785-.842-1.7a.25.25 0 0 0-.182-.135"/>
  <path d="M8.5 1.866a1 1 0 1 0-1 0V3h-2A4.5 4.5 0 0 0 1 7.5V8a1 1 0 0 0-1 1v2a1 1 0 0 0 1 1v1a2 2 0 0 0 2 2h10a2 2 0 0 0 2-2v-1a1 1 0 0 0 1-1V9a1 1 0 0 0-1-1v-.5A4.5 4.5 0 0 0 10.5 3h-2zM14 7.5V13a1 1 0 0 1-1 1H3a1 1 0 0 1-1-1V7.5A3.5 3.5 0 0 1 5.5 4h5A3.5 3.5 0 0 1 14 7.5"/>
</svg>"""

# ======================
# Shiny App
# ======================
app_ui = ui.page_fillable(
    ui.layout_sidebar(
        ui.sidebar(
            ui.div(
                ui.p(ui.strong("Hey, I am DeckCheck!")),
                ui.p(
                    """I can help you improve your Quarto presentations by analysing them and suggesting improvements. Before I can do that, I need some information about your presentation."""
                ),
            ),
            ui.input_file(
                "file",
                "Upload your Quarto presentation",
                accept=[".qmd", ".qmdx"],
                multiple=False,
            ),
            ui.input_text_area(
                "audience",
                "Describe your audience",
                height="150px",
                placeholder="e.g. Python and R users who are curious about AI and large language models, but not all of them have a deep technical background",
            ),
            ui.input_numeric(
                "length", "Time cap for the presentation (minutes)", value=10, min=1
            ),
            ui.input_text(
                "type",
                "Type of talk",
                placeholder="e.g. lightning talk, workshop, or keynote",
            ),
            ui.input_text("event", "Event name", placeholder="e.g. posit::conf(2025)"),
            ui.input_task_button(
                "submit",
                icon=ui.HTML(robot),
                label="Analyse presentation",
            ),
            width=400,
        ),
        ui.layout_column_wrap(
            ui.value_box(
                "Showtime",
                "9 minutes",
                showcase=ui.HTML(file_slides),
                theme="primary",
            ),
            ui.value_box(
                "Code Savviness",
                "15%",
                showcase=ui.HTML(file_code),
                theme="primary",
            ),
            ui.value_box(
                "Image Presence",
                "7%",
                showcase=ui.HTML(file_image),
                theme="primary",
            ),
            width=1 / 3,
            fill=False,
        ),
        ui.layout_column_wrap(
            ui.card(
                ui.card_header(ui.strong("Scores per category")),
                ui.p("My beautiful interactive plot..."),
            ),
            ui.card(
                ui.card_header(ui.strong("Suggested improvements per category")),
                ui.p("My beatiful table..."),
            ),
            width=1 / 2,
            fill=False,
        ),
    ),
    # Bootswatch theme
    theme=shinyswatch.theme.flatly,
)

def server(input, output, session):
    # Empty for demo purposes
    pass

app = App(app_ui, server)
|
 1
 2
 3
 4
 5
 6
 7
 8
 9
10
11
12
13
14
15
16
17
18
19
20
21
22
23
24
25
26
27
28
29
30
31
32
33
34
35
36
37
38
39
40
41
42
43
44
45
46
47
48
49
50
51
52
53
54
55
56
57
58
59
60
61
62
63
64
65
66
67
68
69
70
71
72
73
74
75
76
77
78
79
80
81
82
83
84
85
86
87
88
89
90
91
92
93
94
95
96
|
library(shiny)
library(bslib)

ui <- page_fillable(
  ## General theme and styles
  theme = bs_theme(bootswatch = "flatly"),
  layout_sidebar(
    ## Sidebar content
    sidebar = sidebar(
      width = 400,
      # Open sidebar on mobile devices and show above content
      open = list(mobile = "always-above"),
      strong(p("Hey, I am DeckCheck!")),
      p(
        "I can help you improve your Quarto presentations by analysing them and suggesting improvements.
      Before I can do that, I need some information about your presentation."
      ),
      fileInput(
        inputId = "file",
        label = "Upload your Quarto presentation",
        accept = c(".qmd", ".qmdx")
      ),
      textAreaInput(
        inputId = "audience",
        height = "150px",
        label = "Describe your audience",
        placeholder = "e.g. Python and R users who are curious about AI and large language models, but not all of them have a deep technical background"
      ),
      numericInput(
        inputId = "length",
        label = "Time cap for the presentation (minutes)",
        value = 10
      ),
      textInput(
        inputId = "type",
        label = "Type of talk",
        placeholder = "e.g. lightning talk, workshop, or keynote"
      ),
      textInput(
        inputId = "event",
        label = "Event name",
        placeholder = "e.g. posit::conf(2025)"
      ),
      input_task_button(
        id = "submit",
        label = shiny::tagList(
          bsicons::bs_icon("robot"),
          "Analyse presentation"
        ),
        label_busy = "DeckCheck is checking...",
        type = "default"
      )
    ),
    ## Main content
    layout_column_wrap(
      fill = FALSE,
      ### Value boxes for metrics
      value_box(
        title = "Showtime",
        value = "9 minutes",
        showcase = bsicons::bs_icon("file-slides"),
        theme = "primary"
      ),
      value_box(
        title = "Code Savviness",
        value = "15%",
        showcase = bsicons::bs_icon("file-code"),
        theme = "primary"
      ),
      value_box(
        title = "Image Presence",
        value = "7%",
        showcase = bsicons::bs_icon("file-image"),
        theme = "primary"
      )
    ),
    layout_column_wrap(
      fill = FALSE,
      width = 1 / 2,
      ### Graph with scoring metrics
      card(
        card_header(strong("Scores per category")),
        p("My beatiful interactive plot...")
      ),
      ### Table with suggested improvements
      card(
        card_header(strong("Suggested improvements per category")),
        p("My beatiful table...")
      )
    )
  )
)

server <- function(input, output, session) {}

shinyApp(ui, server)
|
No matter what language you use to display this basic UI, the result is the same:
That’s already a start! Of course it doesn’t do anything yet and is filled with placeholders, so we need some logic in the server part. The main engine behind DeckCheck is our conversation with the LLM. This logic is almost a copy-paste from part two, Talking to LLMs: From Prompt to Response
, combined with what we learned earlier in this article about async.
The star of this main engine is something called “extended task”. As mentioned previously, by default, Shiny runs code synchronously. That means if we ask it to render a Quarto presentation or send a request to an LLM, the app would block until that job is done. The whole interface would freeze. That’s no fun for the user. That’s why Shiny has an option to run extended tasks (extended_task
in Python, ExtendedTask
in R). It lets us run non-blocking jobs asynchronously in the background, so our app can stay responsive. It works together with a special action button, input_task_button, which is designed to trigger long running tasks. In order for this button to work you need to bind the button to the extended task with bind_task_button.
For DeckCheck, there are two main jobs to do:
- Render the presentation (we call this task
quarto_task)
- Takes the uploaded Quarto file.
- Runs Quarto to produce Markdown and HTML versions.
- Returns the file path to the Markdown document.
- Analyse our Markdown slides with the LLM (we call this task
chat_task)
- Waits for the Markdown to be ready, so it can read the content of the Markdown file using the file path.
- Starts a chat session with the model.
- Runs two subtasks:
- A “regular” async chat where the LLM can use our tool to count slides and calculate percentages.
- A structured async chat that returns clean, structured data according to our data model.
Because the LLM depends on the Markdown output, we have to chain these tasks: the button click first kicks off quarto_task, and only when that’s finished, we run chat_task.
This chaining is done through Shiny’s reactive system:
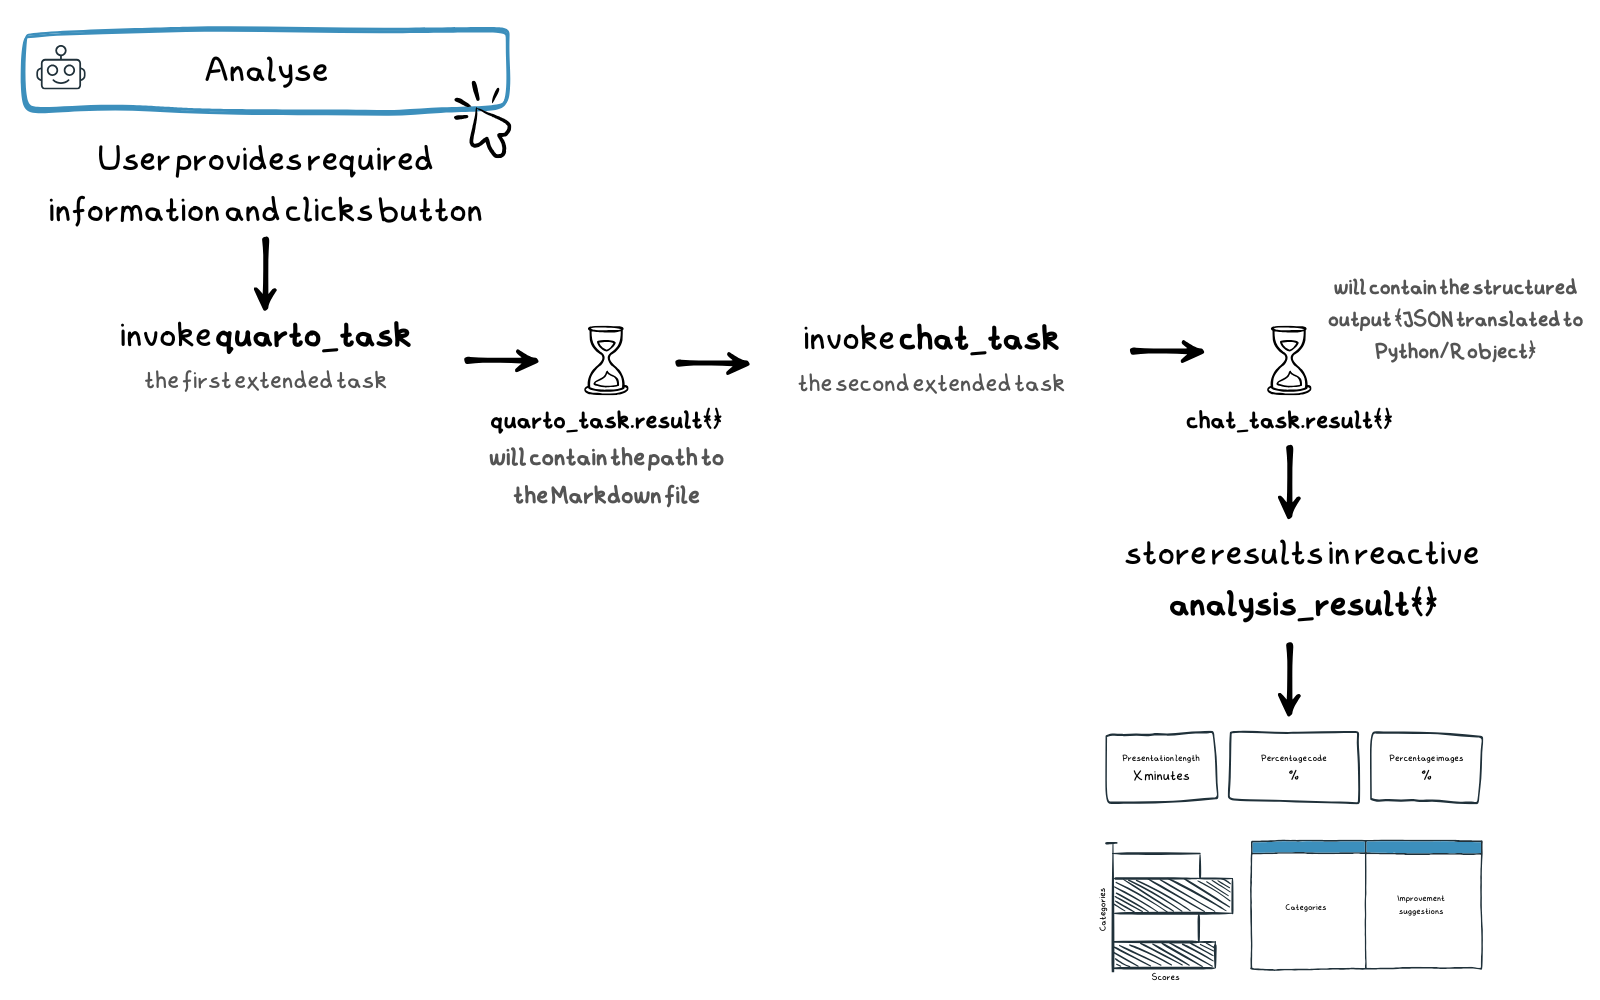
- A reactive effect (
run_quarto in Python) / observer (R) responds to the button press and invokes our first extended task: quarto_task.
- Another reactive effect (
run_chat in Python) / observer (R) listens for quarto_task to finish, then reads the rendered Markdown using the file path and invokes our second extended task: chat_task.
analysis_result is a reactive that listens for chat_task to complete and prepares the final output for the UI.
You can think of it as a pipeline:
This setup keeps the app responsive, ensures tasks run in the right order, and makes the logic clear: the button starts things off, the tasks are executed async (but in order!), and our desired data ends up in a reactive that we can use as information source for all the UI components.
The world of async programming
If you’re used to synchronous code and just running scripts, using asynchronous tasks might feel a bit… complicated? Confusing, perhaps? Ultimately, it requires you to think differently. If you’re keen to learn more, and getting hands on with a bunch of different examples, you can check out the Python
or R
docs about non-blocking operations. The async_shiny
repo also contains examples.
A note on code snippets
Big chunks of code are generally not nice to look at. So, to make sure it’s not too overwhelming we’ll take a look at some snippets from the finalised DeckCheck app. Note that you can’t run these snippets on their own. If you want to run the full DeckCheck application you can head over to the the end result
.
Python#
  1
  2
  3
  4
  5
  6
  7
  8
  9
 10
 11
 12
 13
 14
 15
 16
 17
 18
 19
 20
 21
 22
 23
 24
 25
 26
 27
 28
 29
 30
 31
 32
 33
 34
 35
 36
 37
 38
 39
 40
 41
 42
 43
 44
 45
 46
 47
 48
 49
 50
 51
 52
 53
 54
 55
 56
 57
 58
 59
 60
 61
 62
 63
 64
 65
 66
 67
 68
 69
 70
 71
 72
 73
 74
 75
 76
 77
 78
 79
 80
 81
 82
 83
 84
 85
 86
 87
 88
 89
 90
 91
 92
 93
 94
 95
 96
 97
 98
 99
100
101
102
103
104
105
106
107
108
109
110
111
112
113
114
115
116
117
118
119
120
121
122
123
124
125
126
127
128
129
130
131
132
133
134
135
136
137
138
139
140
141
142
143
144
145
146
147
148
149
150
151
152
153
154
155
156
157
158
159
160
161
162
163
164
165
|
# ======================
# Data Structure
# ======================
ScoreType = Annotated[int, Field(ge=0, le=10)]
PercentType = Annotated[float, Field(ge=0.0, le=100.0)]
MinutesType = Annotated[int, Field(ge=0)]
SlideCount = Annotated[int, Field(ge=0)]

class ScoringCategory(BaseModel):
    score: ScoreType = Field(..., description="Score from 1–10.")
    justification: str = Field(..., description="Brief explanation of the score.")
    improvements: Optional[str] = Field(
        None,
        description="Concise, actionable improvements, mentioning slide numbers if applicable.",
    )
    score_after_improvements: ScoreType = Field(
        ..., description="Estimated score after suggested improvements."
    )

class DeckAnalysis(BaseModel):
    presentation_title: str = Field(..., description="The presentation title.")
    total_slides: SlideCount
    percent_with_code: PercentType
    percent_with_images: PercentType
    estimated_duration_minutes: MinutesType
    tone: str = Field(
        ..., description="Brief description of the tone of the presentation."
    )

    clarity: ScoringCategory = Field(
        ...,
        description="Evaluate how clearly the ideas are communicated. Are the explanations easy to understand? Are terms defined when needed? Is the key message clear?",
    )
    relevance: ScoringCategory = Field(
        ...,
        description="Assess how well the content matches the audience's background, needs, and expectations. Are examples, depth of detail, and terminology appropriate for the audience type?",
    )
    # Truncated for brevity
    # ...

# ======================
# Shiny App
# ======================
app_ui = ui.page_fillable(
    ## Our UI
    # ...
    ui.input_task_button(
        "submit",
        icon=ui.HTML(robot),
        label="Analyse presentation",
    )
    # ...
)

def server(input, output, session):
    @ui.bind_task_button(button_id="submit")
    @reactive.extended_task
    async def quarto_task(file_path, temp_dir):
        # We're using an Extended Task to avoid blocking. Note that
        # a temporary directory called within mirai will be
        # different from the one in the "main" Shiny session. Hence,
        # we pass a temp_dir parameter to the task and use that.
        qmd_file = Path(temp_dir) / "my-presentation.qmd"
        shutil.copy(file_path, qmd_file)

        # Run asyncio subprocess
        proc = await asyncio.create_subprocess_exec(
            "quarto", "render", str(qmd_file), "--to", "markdown,html"
        )
        await proc.communicate()

        # Return the path to the markdown file
        return Path(temp_dir) / "my-presentation.md"

    @ui.bind_task_button(button_id="submit")
    @reactive.extended_task
    async def chat_task(system_prompt, markdown_content, DeckAnalysis):
        # We're using an extended task to avoid blocking the session and
        # we start a fresh chat session each time.
        # For a feedback loop, we would use a persistent chat session.
        chat = ChatAnthropic(
            model="claude-sonnet-4-20250514",
            system_prompt=system_prompt,
        )

        # Set model parameters (optional)
        chat.set_model_params(
            temperature=0.8,  # default is 1
        )

        # Register the tool with the chat
        chat.register_tool(calculate_slide_metric)

        # Start conversation with the chat
        # Task 1: regular chat to extract meta-data
        chat_res1 = await chat.chat_async(
            interpolate(
                "Execute Task 1 (counts). Here are the slides in Markdown: {{ markdown_content }}"
            )
        )

        print(chat_res1)

        # Task 2: structured chat to further analyse the slides
        chat_res2 = await chat.chat_structured_async(
            "Execute Task 2 (suggestions)",
            data_model=DeckAnalysis,
        )

        return chat_res2

    @reactive.effect
    @reactive.event(input.submit)
    async def run_quarto():
        req(input.file() is not None)

        # Get file path of the uploaded file
        file_path = input.file()[0]["datapath"]

        quarto_task.invoke(file_path, tempfile.gettempdir())

    @reactive.effect
    def run_chat():
        # require quarto_task result to be available
        req(quarto_task.result() is not None)

        # Get the Markdown file path from the complete quarto_task
        markdown_file = quarto_task.result()
        # Read the generated Markdown file containing the slides
        markdown_content = markdown_file.read_text(encoding="utf-8")

        # Define prompt file
        system_prompt_file = (
            ROOT_DIR / "prompts" / "prompt-analyse-slides-structured-tool.md"
        )

        # Create system prompt
        system_prompt = interpolate_file(
            system_prompt_file,
            variables={
                "audience": input.audience(),
                "length": input.length(),
                "type": input.type(),
                "event": input.event(),
                "markdown_content": markdown_content,
            },
        )

        # Trigger the chat task with the provided inputs
        chat_task.invoke(system_prompt, markdown_content, DeckAnalysis)

        # This reactive will be used as information source for
        # all the UI elements. It uses the result from the chat_task,
        # and does some data wrangling
    @reactive.calc
    def analysis_result():
        res = chat_task.result()
        if res is not None:
                # Some data wrangling
                # ...
            return res
        else:
            return None

app = App(app_ui, server)
|
Note that quarto_task is marked async, so it automatically returns a coroutine. You need a coroutine for extended_task to work. The subprocess call to Quarto runs without blocking (await asyncio.create_subprocess_exec). Once Quarto finishes, the task resolves with the path to the Markdown file. The async chat tasks from chatlas return a coroutine too.
  1
  2
  3
  4
  5
  6
  7
  8
  9
 10
 11
 12
 13
 14
 15
 16
 17
 18
 19
 20
 21
 22
 23
 24
 25
 26
 27
 28
 29
 30
 31
 32
 33
 34
 35
 36
 37
 38
 39
 40
 41
 42
 43
 44
 45
 46
 47
 48
 49
 50
 51
 52
 53
 54
 55
 56
 57
 58
 59
 60
 61
 62
 63
 64
 65
 66
 67
 68
 69
 70
 71
 72
 73
 74
 75
 76
 77
 78
 79
 80
 81
 82
 83
 84
 85
 86
 87
 88
 89
 90
 91
 92
 93
 94
 95
 96
 97
 98
 99
100
101
102
103
104
105
106
107
108
109
110
111
112
113
114
115
116
117
118
119
120
121
122
123
124
125
126
127
128
129
130
131
132
133
134
135
136
137
138
139
140
141
142
143
144
145
146
147
148
149
150
151
152
153
154
155
156
157
158
159
160
161
162
163
164
165
166
167
168
169
170
171
172
173
174
175
176
177
178
179
180
181
182
183
184
185
186
187
188
189
190
191
|
# ======================
# Data Structure
# ======================
# Reusable scoring category
type_scoring_category <- type_object(
  score = type_integer(
    description = "Score from 1 to 10."
  ),
  justification = type_string(
    description = "Brief explanation of the score."
  ),
  improvements = type_string(
    description = "Concise, actionable improvements, mentioning slide numbers if applicable.",
    required = FALSE
  ),
  score_after_improvements = type_integer(
    description = "Estimated score after suggested improvements."
  )
)

# Top-level deck analysis object
type_deck_analysis <- type_object(
  presentation_title = type_string(description = "The presentation title."),
  total_slides = type_integer(description = "Total number of slides."),
  percent_with_code = type_number(
    description = "Percentage of slides containing code blocks (0–100)."
  ),
  percent_with_images = type_number(
    description = "Percentage of slides containing images (0–100)."
  ),
  estimated_duration_minutes = type_integer(
    description = "Estimated presentation length in minutes, assuming ~1 minute per text slide and 2–3 minutes per code or image-heavy slide."
  ),
  tone = type_string(
    description = "Brief description of the presentation tone (e.g., informal, technical, playful)."
  ),
  clarity = type_array(
    description = "Evaluate how clearly the ideas are communicated. Are the explanations easy to understand? Are terms defined when needed? Is the key message clear?",
    type_scoring_category
  ),
  relevance = type_array(
    description = "Asses how well the content matches the audience's background, needs, and expectations. Are examples, depth of detail, and terminology appropriate for the audience type?",
    type_scoring_category
  ),
  # Truncated for brevity
  # ...
)

# ======================
# Shiny App
# ======================
ui <- page_fillable(
  ## Our UI
  # ...
  input_task_button(
    id = "submit",
    label = shiny::tagList(
      bsicons::bs_icon("robot"),
      "Analyse presentation"
    ),
    label_busy = "DeckCheck is checking...",
    type = "default"
  )
  # ...
)

server <- function(input, output, session) {
  quarto_task <- ExtendedTask$new(function(file_path, temp_dir) {
    # We're using an Extended Task to avoid blocking. Note that
    # a temporary directory called within mirai will be
    # different from the one in the "main" Shiny session. Hence,
    # we pass a temp_dir parameter to the task and use that.
    mirai(
      {
        qmd_file <- file.path(temp_dir, "my-presentation.qmd")
        file.copy(file_path, qmd_file, overwrite = TRUE)

        quarto::quarto_render(
          input = qmd_file,
          output_format = c("markdown", "html")
        )

        # Return the path to the markdown file
        file.path(temp_dir, "my-presentation.md")
      },
      # Use the same environment as the Shiny app
      environment()
    )
  }) |>
    bind_task_button("submit")

  chat_task <- ExtendedTask$new(function(
    system_prompt,
    markdown_content,
    type_deck_analysis
  ) {
    # We're using an Extended Task to avoid blocking the session and
    # we start a fresh chat session each time.
    # For a feedback loop, we would use a persistent chat session.
    chat <- chat_anthropic(
      model = "claude-sonnet-4-20250514",
      system_prompt = system_prompt,
      params = params(
        temperature = 0.8 # default is 1
      )
    )

    # Register the tool with the chat
    chat$register_tool(calculate_slide_metric)

    # Start conversation with the chat
    # Task 1: regular chat to extract meta-data
    chat_res <- chat$chat_async(
      interpolate(
        "Execute Task 1 (counts). Here are the slides in Markdown: {{ markdown_content }}"
      )
    )

    chat_res$then(function(res) {
      # Print the response from Task 1
      cat("Response from Task 1:\n")
      cat(res, "\n\n")

      # Execute next task
      # Task 2: structured chat to further analyse the slides
      chat$chat_structured_async(
        "Execute Task 2 (suggestions)",
        type = type_deck_analysis
      )
    })
  }) |>
    bind_task_button("submit")

  observe({
    req(input$file)
    req(input$audience)
    req(input$length)
    req(input$type)
    req(input$event)

    # Get file path of the uploaded file
    file_path <- input$file$datapath

    quarto_task$invoke(file_path, temp_dir = tempdir())
  }) |>
    bindEvent(input$submit)

  observe({
    req(quarto_task$result())

    # Get the Markdown file path from the completed quarto_task
    markdown_file <- quarto_task$result()
    # Read the generated Markdown file containing the slides
    markdown_content <- readChar(markdown_file, file.size(markdown_file))

    # Define prompt file
    system_prompt_file <- here::here(
      "prompts",
      "prompt-analyse-slides-structured-tool.md"
    )

    # Create system prompt
    system_prompt <- interpolate_file(
      path = system_prompt_file,
      audience = input$audience,
      length = input$length,
      type = input$type,
      event = input$event
    )

    # Trigger the chat task with the provided inputs
    chat_task$invoke(
      system_prompt = system_prompt,
      markdown_content = markdown_content,
      type_deck_analysis = type_deck_analysis
    )
  })

  # This reactive will be used as information source for
    # all the UI elements. It uses the result from the chat_task,
    # and does some data wrangling
  analysis_result <- reactive({
    named_list <- chat_task$result()

        # Some data wrangling
        # ...

    named_list
  })

shinyApp(ui, server)
|
Note that we wrap the Quarto task in mirai because we need a promise. Basically an object that says: “I don’t have the answer yet, but I will later”. ExtendedTask is built to work with promises and it expects whatever you give it to eventually resolve with a value. The async chat tasks from ellmer return a promise too.
In this case, we choose to start a fresh chat session each time. Another way to do this would be to bring up the code that initialises the chat client, set model parameters, and registers our tool so it only runs once at the start of the session. Then, we could use chat.set_turns([])
(Python) / chat$set_turns([])
(R) before each new “chat task”. This way, we won’t accumulate chat history.
Towards a better UI#
There’s an engine, and there’s a basic UI. Time to put them together. But if we want a Shiny app to truly shine, we need to give the UI a little extra love. In this section, we’ll go over all the UI elements that we have in our design, plus some extra goodies. The suggestions here are just examples though, the possibilities go far beyond what we’ll cover here.
Loading experience#
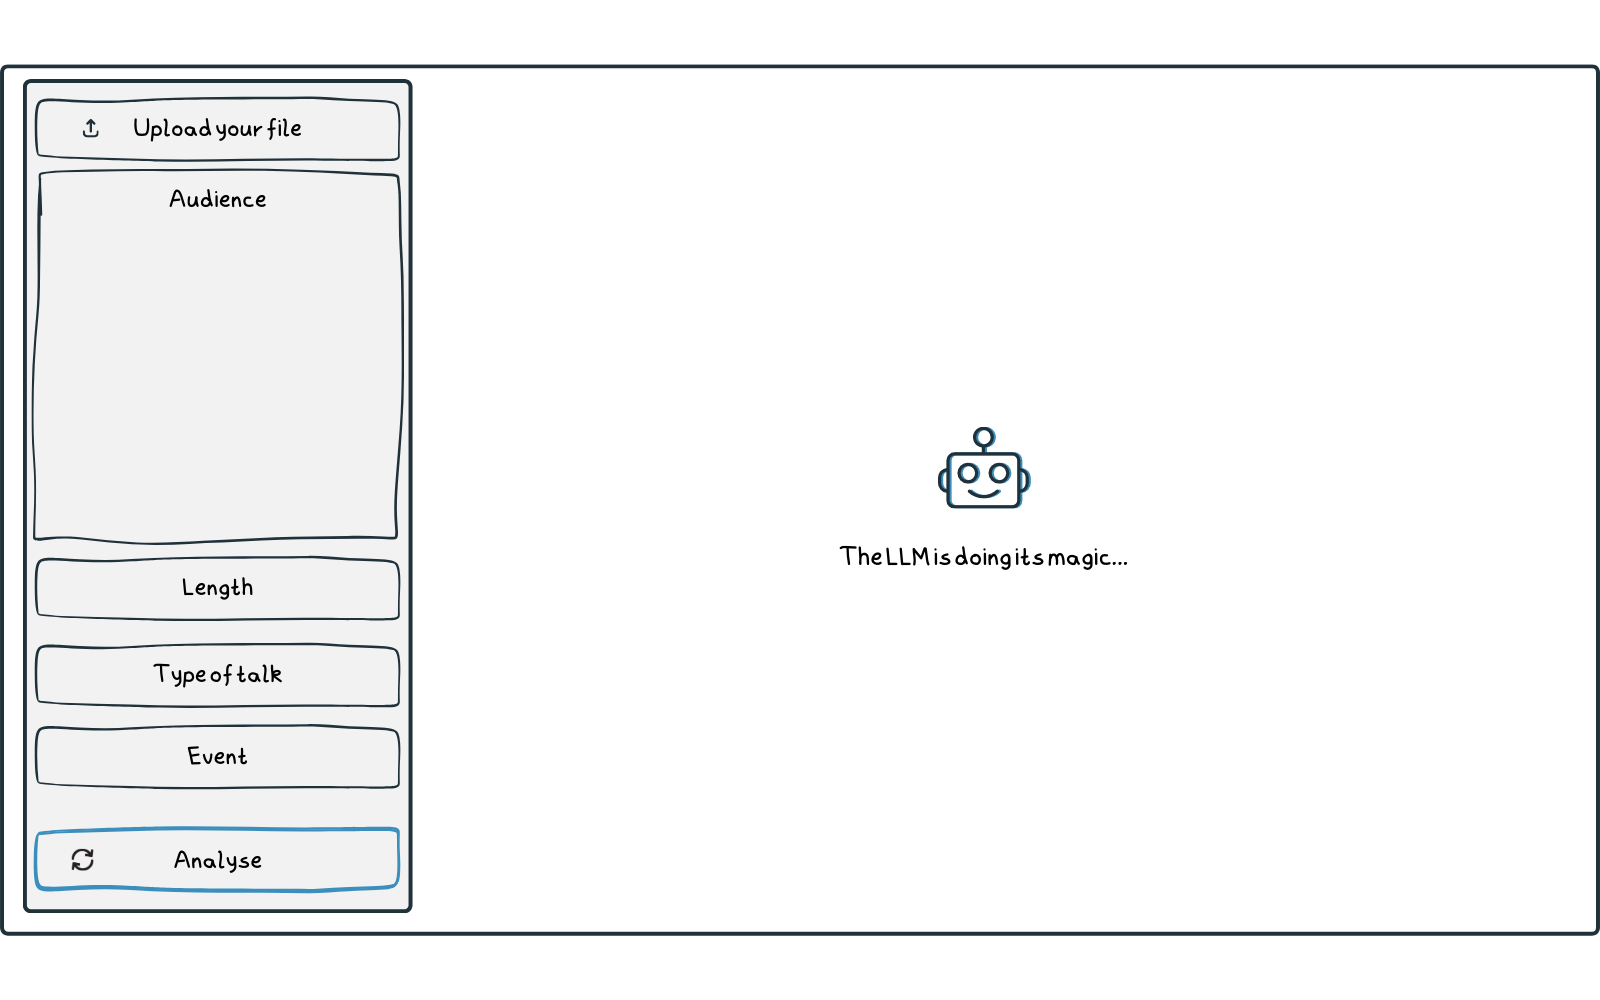
The fact that we’re executing tasks asynchronously doesn’t change anything about the execution speed of those tasks. It still takes time to render Quarto, and it still takes time to get a response from the LLM. And since we do need to finish one task before starting the other, there’s zero time gain compared to running the code synchronously for individual users. We simply made the app non-blocking, which is especially valuable if there are multiple users running the app at the same time (concurrently).
We already talked about the impatience of users and how visual feedback can make waiting a bit more enjoyable. So, in DeckCheck, we also need to make sure to provide such feedback. We want it to be informative (e.g. “Processing your Quarto presentation…” or “The LLM is doing its magic…”) and we want it to be entertaining (bouncing robot anyone?!).
A nice way to add such a custom loading experience is with the help of output_ui
(Python) / uiOutput
(R). It serves as a placeholder in your UI that gets filled later with server-generated UI via render.ui() (Python) / renderUI() (R). This lets you create dynamic interfaces that change depending on app state. For example, we can start by rendering a loading animation (like a bouncing icon), and once the results are ready, replace it with more complex UI elements such as value boxes, a graph, and a table.
Python#
 1
 2
 3
 4
 5
 6
 7
 8
 9
10
11
12
13
14
15
16
17
18
19
20
21
22
23
24
25
26
27
28
29
30
31
32
33
34
35
36
37
38
39
40
41
42
43
44
45
46
47
|
# ======================
# Shiny App
# ======================
app_ui = ui.page_fillable(
    # ...
    ui.layout_sidebar(
        ui.sidebar(
            # Sidebar content
            # ...
        ),
        # Main content is now dynamic
        ui.output_ui("results"),
    ),
    # ...
)

def server(input, output, session):

    # ...

    @render.ui
    async def results():
        if quarto_task.status() == "running":
            return ui.div(
                ui.HTML(file_slides_loader),
                ui.br(),
                ui.p("Processing your Quarto presentation..."),
                class_="text-center d-flex flex-column justify-content-center align-items-center",
                style="height: 100%",
            )

        elif chat_task.status() == "running":
            return ui.div(
                ui.HTML(robot_loader),
                ui.br(),
                ui.p("The LLM is doing its magic..."),
                class_="text-center d-flex flex-column justify-content-center align-items-center",
                style="height: 100%",
            )

        elif chat_task.status() == "success":
            return ui.TagList(
                # Final results UI components
                # ...
            )

app = App(app_ui, server)
|
 1
 2
 3
 4
 5
 6
 7
 8
 9
10
11
12
13
14
15
16
17
18
19
20
21
22
23
24
25
26
27
28
29
30
31
32
33
34
35
36
37
38
39
40
41
42
43
44
45
46
47
48
49
50
51
52
53
|
# ======================
# Shiny App
# ======================
ui <- page_fillable(
  # ...
  layout_sidebar(
    # Sidebar content
    # ...
    ),
    # Main content is now dynamic
    uiOutput("results", height = "100%")
    # ...
  )
)

server <- function(input, output, session) {

  # ...

  output$results <- renderUI({
    if (quarto_task$status() == "running") {
      div(
        class = "text-center d-flex flex-column justify-content-center align-items-center",
        style = "height: 100%;",
        bsicons::bs_icon(
          "file-slides",
          size = "6em",
          class = "text-primary bounce"
        ),
        br(),
        p("Processing your Quarto presentation...")
      )
    } else if (chat_task$status() == "running") {
      div(
        class = "text-center d-flex flex-column justify-content-center align-items-center",
        style = "height: 100%;",
        bsicons::bs_icon(
          "robot",
          size = "6em",
          class = "text-primary bounce"
        ),
        br(),
        p("The LLM is doing its magic...")
      )
    } else if (chat_task$status() == "success") {
      tagList(
        # Final results UI components
        # ...
      )
    }
  })

shinyApp(ui, server)
|
Using extended task, we can easily monitor the status with quarto_task$status() and chat_task$status(). The status can be "initial", "running", "success", or "error". So whenever our Quarto task is running, we can display a bouncing presentation easel (or whatever you like). And once that task is finished and we start with our chat task, we can show a bouncing robot. The HTML for those bouncing icons is pretty straightforward: a simple div that puts the icon in the middle. For the bounce effect we need some custom CSS that we can add with the .bounce class. It looks like this:
 1
 2
 3
 4
 5
 6
 7
 8
 9
10
11
12
|
.bounce {
    animation: bounce 2s infinite;
}

@keyframes bounce {
    0%, 100% {
        transform: translateY(0);
    }
    50% {
        transform: translateY(-20px);
    }
}
|
We’ll look at how to add this custom CSS to your Shiny app a little later.
Built-in busy indicators
By default, a page-level pulsing banner and a spinner will be shown on recalculating outputs like plots and tables. This means that whenever the app is busy with calculations (like getting the results from an LLM) there will be some visual feedback for the user. You can change the appearance and options of these busy indicators with ui.busy_indicators.options
(Python) / busyIndicatorOptions
(R). In Python, a spinner shows by default on output_plot and output_data_frame. In R, on plotOutput and tableOutput. Spinners won’t be shown on value boxes and HTML widgets, that’s why a spinner overlay like in our example works well.
What a lovely result 🤖:
With value boxes you can display key numbers. The idea is simple: show a number or short text, add an image, icon, or sparkline, and make sure the value updates whenever the underlying data changes.
Value boxes can be enhanced with tooltips. Tooltips are one of those small details that make a big difference. They’re perfect for adding extra information without cluttering up your interface. Think of them as extra context that appears when someone hovers or taps. You can use them to explain numbers or tricky terms, add short instructions, highlight what a button actually does, or even drop in a quick example. In our case, we could add tooltips to the value boxes to tell our users how the numbers were calculated.
Python#
UI:
 1
 2
 3
 4
 5
 6
 7
 8
 9
10
11
12
13
14
15
|
# SVG icon copied from https://icons.getbootstrap.com/icons/file-slides-fill/
file_slides = """<svg xmlns="http://www.w3.org/2000/svg" fill="currentColor" class="bi bi-file-slides-fill" viewBox="0 0 16 16">
  <path d="M7 7.78V5.22c0-.096.106-.156.19-.106l2.13 1.279a.125.125 0 0 1 0 .214l-2.13 1.28A.125.125 0 0 1 7 7.778z"/>
  <path d="M12 0H4a2 2 0 0 0-2 2v12a2 2 0 0 0 2 2h8a2 2 0 0 0 2-2V2a2 2 0 0 0-2-2M5 4h6a.5.5 0 0 1 .496.438l.5 4A.5.5 0 0 1 11.5 9h-3v2.016c.863.055 1.5.251 1.5.484 0 .276-.895.5-2 .5s-2-.224-2-.5c0-.233.637-.429 1.5-.484V9h-3a.5.5 0 0 1-.496-.562l.5-4A.5.5 0 0 1 5 4"/>
</svg>"""

ui.tooltip(
    ui.value_box(
        "Showtime",
        ui.output_text("showtime"),
        showcase=ui.HTML(file_slides),
        theme="primary",
    ),
    "Slides are being counted based on the provided Quarto presentation, then an educated guess is made about the time it will take to present them.",
)
|
Server:
1
2
3
4
5
6
|
@render.text
def showtime():
    res = analysis_result()

    req(res is not None)
    return f"{res['meta']['estimated_duration_minutes']} minutes"
|
In this case, the value contains some text (the length of the presentation in minutes) and a showcase (an icon), but use your creativity to build anything you want! You can find some fun examples here
.
You can add a tooltip
to any UI element with ui.tooltip(). In this case, the tooltip is applied to the complete value box.
The result:
UI:
 1
 2
 3
 4
 5
 6
 7
 8
 9
10
11
12
|
value_box(
  title = tooltip(
    span(
      "Showtime ",
      bsicons::bs_icon("question-circle-fill")
    ),
    "Slides are being counted based on the provided Quarto presentation, then an educated guess is made about the time it will take to present them."
  ),
  value = textOutput("showtime"),
  showcase = bsicons::bs_icon("file-slides"),
  theme = "primary"
)
|
Server:
1
2
3
4
5
6
7
|
output$showtime <- renderText({
  req(analysis_result())
  paste0(
    analysis_result()$meta$estimated_duration_minutes,
    " minutes"
  )
})
|
Looking for more fun examples? Take a look here
.
You can add a tooltip to any UI element with tooltip(). In this case, the tooltip is applied to a little info icon (generated with span and bs_icon). Alternatively, you could also apply it to the complete value box.
The result:
Interactive plots#
Is it even a data-powered app if there isn’t a good plot?!
There are plenty of options when it comes to visualisation libraries, and many of them support interactivity as well. With Shiny you can easily add interactive plots, and you can even link events (clicking, brushing, hovering) to other parts of your app. For example, adding click and brushing would let users dig deeper into the results. Clicking on a bar in our score graph could filter the table down to just that category’s feedback, while brushing across multiple bars would make it possible to look at several categories side by side. And lets not forget about hovering: users expect to see more information when they hover over a score. You can control click, brush, and hover events with output_plot
(Python) / plotOutput
(R). This makes it easy to send values back to the server. To give an example: you can show a modal when someone clicks on a bar.
To keep the demo light, we’re not going to focus too much on these events. But there’s one thing that we can add very easily and is supported by most interactive visualisation libraries: tooltips on hover! When you hover over a bar (or a line, or a point, you get it), you’ll see a quick popup with more information. In our case: the score and the justification. Even this small touch already makes the chart feel more alive, and it’s easy to imagine how combining clicks, brushing, and tooltips could make DeckCheck even cooler.
Python#
Tip
Want to create plots based on the grammar of graphics? Take a look at plotnine
! Unfortunately not interactive (yet), but you can make really pretty figures that would fit nicely into an app.
In Python, you have plenty of options for interactive plots, like Plotly
or Altair
. The choice is yours! Our weapon of choice for DeckCheck: Plotly.
To make a Plotly plot interactive, you need shinywidgets
. More specifically: output_widget on the UI side, and render_widget on the server side. It connects Shiny with ipywidgets, letting your sliders, dropdowns, and buttons actually control the plot.
UI:
1
2
3
4
5
|
ui.card(
    ui.card_header(ui.strong("Scores per category")),
    output_widget("scores"),
    height="600px",
)
|
Server:
 1
 2
 3
 4
 5
 6
 7
 8
 9
10
11
12
13
14
15
16
17
18
19
20
21
22
23
24
25
26
27
28
29
30
31
32
33
34
35
36
37
38
39
40
41
42
43
44
45
|
@render_widget
def scores():
    res = analysis_result()

    req(res is not None)

    evals = res["evals"].copy()
    evals = evals.sort_values("score")
    evals["category"] = pd.Categorical(
        evals["category"], categories=evals["category"], ordered=True
    )

    # apply to the justification column
    evals["justification_wrapped"] = evals["justification"].apply(add_line_breaks)

    # Create a custom tooltip column
    evals["tooltip"] = (
        "Score: "
        + evals["score"].astype(str)
        + "<br>After improvements: "
        + evals["score_after_improvements"].astype(str)
        + "<br>Justification: "
        + evals["justification_wrapped"]
    )

    plot = px.bar(
        evals,
        x="score",
        y="category",
        orientation="h",
        labels={"category": "Category", "score": "Score"},
        hover_data={"tooltip": True},  # include the tooltip column
    )

    # Set hovertemplate to use our custom tooltip
    plot.update_traces(
        hovertemplate="%{customdata[0]}<extra></extra>",
        customdata=evals[["tooltip"]].values,
    )

    plot.update_traces(marker_color="#18bc9c")

    plot.update_layout(template="simple_white")

    return plot
|
To construct the tooltip we create a little helper to make sure there are line breaks. Otherwise the tooltip runs of the screen!
 1
 2
 3
 4
 5
 6
 7
 8
 9
10
11
12
13
14
15
16
17
18
19
20
21
22
23
|
# ======================
# Tooltip helper
# ======================
def add_line_breaks(text, width=50):
    if not isinstance(text, str):
        return text

    words = text.split()
    lines = []
    current_line = ""

    for word in words:
        # +1 accounts for the space if current_line isn't empty
        if len(current_line) + len(word) + (1 if current_line else 0) <= width:
            current_line += (" " if current_line else "") + word
        else:
            lines.append(current_line)
            current_line = word

    if current_line:
        lines.append(current_line)

    return "<br>".join(lines)
|
The result is simple, but effective:
Cross-widget interactions
Interested in cross-widget interactions like linked brushing and filtering? Take a look at crosstalk
.
Where would we be without our beloved ggplot2… So of course it would be nice if we can could make our ggplot2 interactive. The solution: ggiraph
! With ggiraph you can simply add tooltips, hover effects, and JavaScript actions to your plots. There’s plenty of options to alter the look and feel of the interactive elements, so you can be very creative. If you’re looking for more inspiration with ggiraph, check out this post
by Isabella Velásquez.
We’ll stick to the basic with DeckCheck by adding geom_bar_interactive
and some tooltip options. To make it all work we need to use girafeOutput and renderGirafe (as opposed to plotOutput and renderPlot).
UI:
1
2
3
4
5
6
7
8
9
|
card(
  height = 600,
  card_header(
    strong("Scores per category")
  ),
  girafeOutput(
    outputId = "scores"
  )
)
|
Server:
 1
 2
 3
 4
 5
 6
 7
 8
 9
10
11
12
13
14
15
16
17
18
19
20
21
22
23
24
25
26
27
28
29
30
31
32
33
34
35
36
37
38
39
40
41
42
43
44
45
46
47
48
49
50
51
52
53
54
55
56
57
|
  output$scores <- renderGirafe({
    req(analysis_result())

    evals <- analysis_result()$evals

    # Order by score
    data <- evals |>
      arrange(score) |>
      mutate(
        category = factor(category, levels = category),
        tooltip = paste0(
          "Score: ",
          score,
          "\n",
          "After improvements: ",
          score_after_improvements,
          "\n",
          "Justification: ",
          justification
        )
      ) |>
      select(category, score, score_after_improvements, tooltip)

    p <- ggplot(
      data,
      aes(x = category, y = score, tooltip = tooltip, data_id = category)
    ) +
      geom_bar_interactive(
        stat = "identity",
        fill = "#18bc9c" # Success color of Flatly theme
      ) +
      labs(
        x = "Category",
        y = "Score"
      ) +
      # Flip to make horizontal bar chart
      coord_flip() +
      theme_minimal(base_family = "Lato", base_size = 14) +
      theme(legend.position = "none")

    girafe(
      ggobj = p,
      options = list(
        opts_selection(type = "none"),
        opts_sizing(rescale = TRUE),
        opts_tooltip(
          css = "background-color: #f0f0f0; color: #333; padding: 5px; border-radius: 5px; width: 200px;"
        ),
        opts_hover(
          css = "."
        ),
        opts_hover_inv(
          css = "opacity: 0.5;"
        )
      )
    )
  })
|
And that’s how you add interactivity to your ggplot2 fast:
Tables#
Another element that you’ll see in web apps: tables. The good news is: displaying your data in Shiny is super easy. Got a pandas/polars/narwhals DataFrame in Python? Or a data.frame/tibble/data.table in R? You can drop it straight into render.data_frame
/ output_data_frame
(Python) or renderTable
/ tableOutput
(R) (and many other similar functions for some variety).
Python#
Other ways to render your table
You can also take a look at render.DataGrid
(spreadsheet-like view), render.table
(basic HTML table, not as nice as render.data_frame
) and render.DataTable
(more tabular view of data).
UI:
1
2
3
4
5
6
7
|
ui.card(
    ui.card_header(
        ui.strong("Suggested improvements per category")
    ),
    ui.output_data_frame("suggested_improvements"),
    height="600px",
)
|
Server:
 1
 2
 3
 4
 5
 6
 7
 8
 9
10
11
12
13
14
15
16
17
18
19
20
21
22
23
24
25
26
|
@render.data_frame
def suggested_improvements():
    res = analysis_result()

    req(res is not None)

    evals = res["evals"].copy()
    evals["Gain"] = evals["score_after_improvements"] - evals["score"]

    result_table = evals.assign(
        Category=evals["category"],
        **{"Current score": evals["score"]},
        Improvements=evals["improvements"],
        **{"Score After Improvements": evals["score_after_improvements"]},
        Gain=evals["Gain"],
    )[
        [
            "Category",
            "Current score",
            "Improvements",
            "Score After Improvements",
            "Gain",
        ]
    ].sort_values("Gain", ascending=False)

    return result_table
|
More fun table libraries
Want to have some fun with JavaScript based tables? Check out reactable
, which is based on the React Table
library. Or, go for gt
! You can get some inspo from the Shiny components gallery
.
UI:
1
2
3
4
5
6
7
|
card(
  height = 600,
  card_header(strong("Suggested improvements per category")),
  tableOutput(
    outputId = "suggested_improvements"
  )
)
|
Server:
 1
 2
 3
 4
 5
 6
 7
 8
 9
10
11
12
13
14
15
16
17
18
19
|
output$suggested_improvements <- renderTable({
  req(analysis_result())

  evals <- analysis_result()$evals

  evals |>
    arrange(score) |>
    mutate(
      Gain = score_after_improvements - score
    ) |>
    select(
      Category = category,
      `Current score` = score,
      Improvements = improvements,
      `Score After Improvements` = score_after_improvements,
      Gain
    ) |>
    arrange(desc(Gain))
})
|
Error catching#
An error. The thing we don’t want to see in our app. Errors reduce user experience, big time. A frozen app or red error messages don’t make your users happy. And for you, as a developer, you’re not too happy about them either. Unfortunately, it’s hard to completely avoid getting errors: you’ll always see that there’s a specific scenario that you haven’t thought about. But that doesn’t mean you have to just let it happen: you can catch errors so your users are not confronted with a frozen app or messages they can’t understand. Instead, you can confront your users with a friendly (and hopefully useful) message.
One thing worth knowing: in Shiny, if an error happens inside a reactive expression or an observer, the default behaviour is for the app to crash. That’s because Shiny has no way of knowing whether the error is fatal or not, and it doesn’t really have a natural place to show that error to the user. With LLM apps, this becomes a bigger deal: errors happen often, they’re not always fatal, and it’s really frustrating for your users if the whole app crashes and they lose their conversation history. Models can return unexpected output, an API call might time out, the API might be overloaded by your requests (been there, done that), or the user could upload something your app doesn’t know how to handle. That’s why you want to deal with errors “gracefully”. And luckily, you don’t have to reinvent the wheel here. For example, the Chat component automatically catches errors that happen while streaming and shows the user a short explanation instead of breaking the whole app.
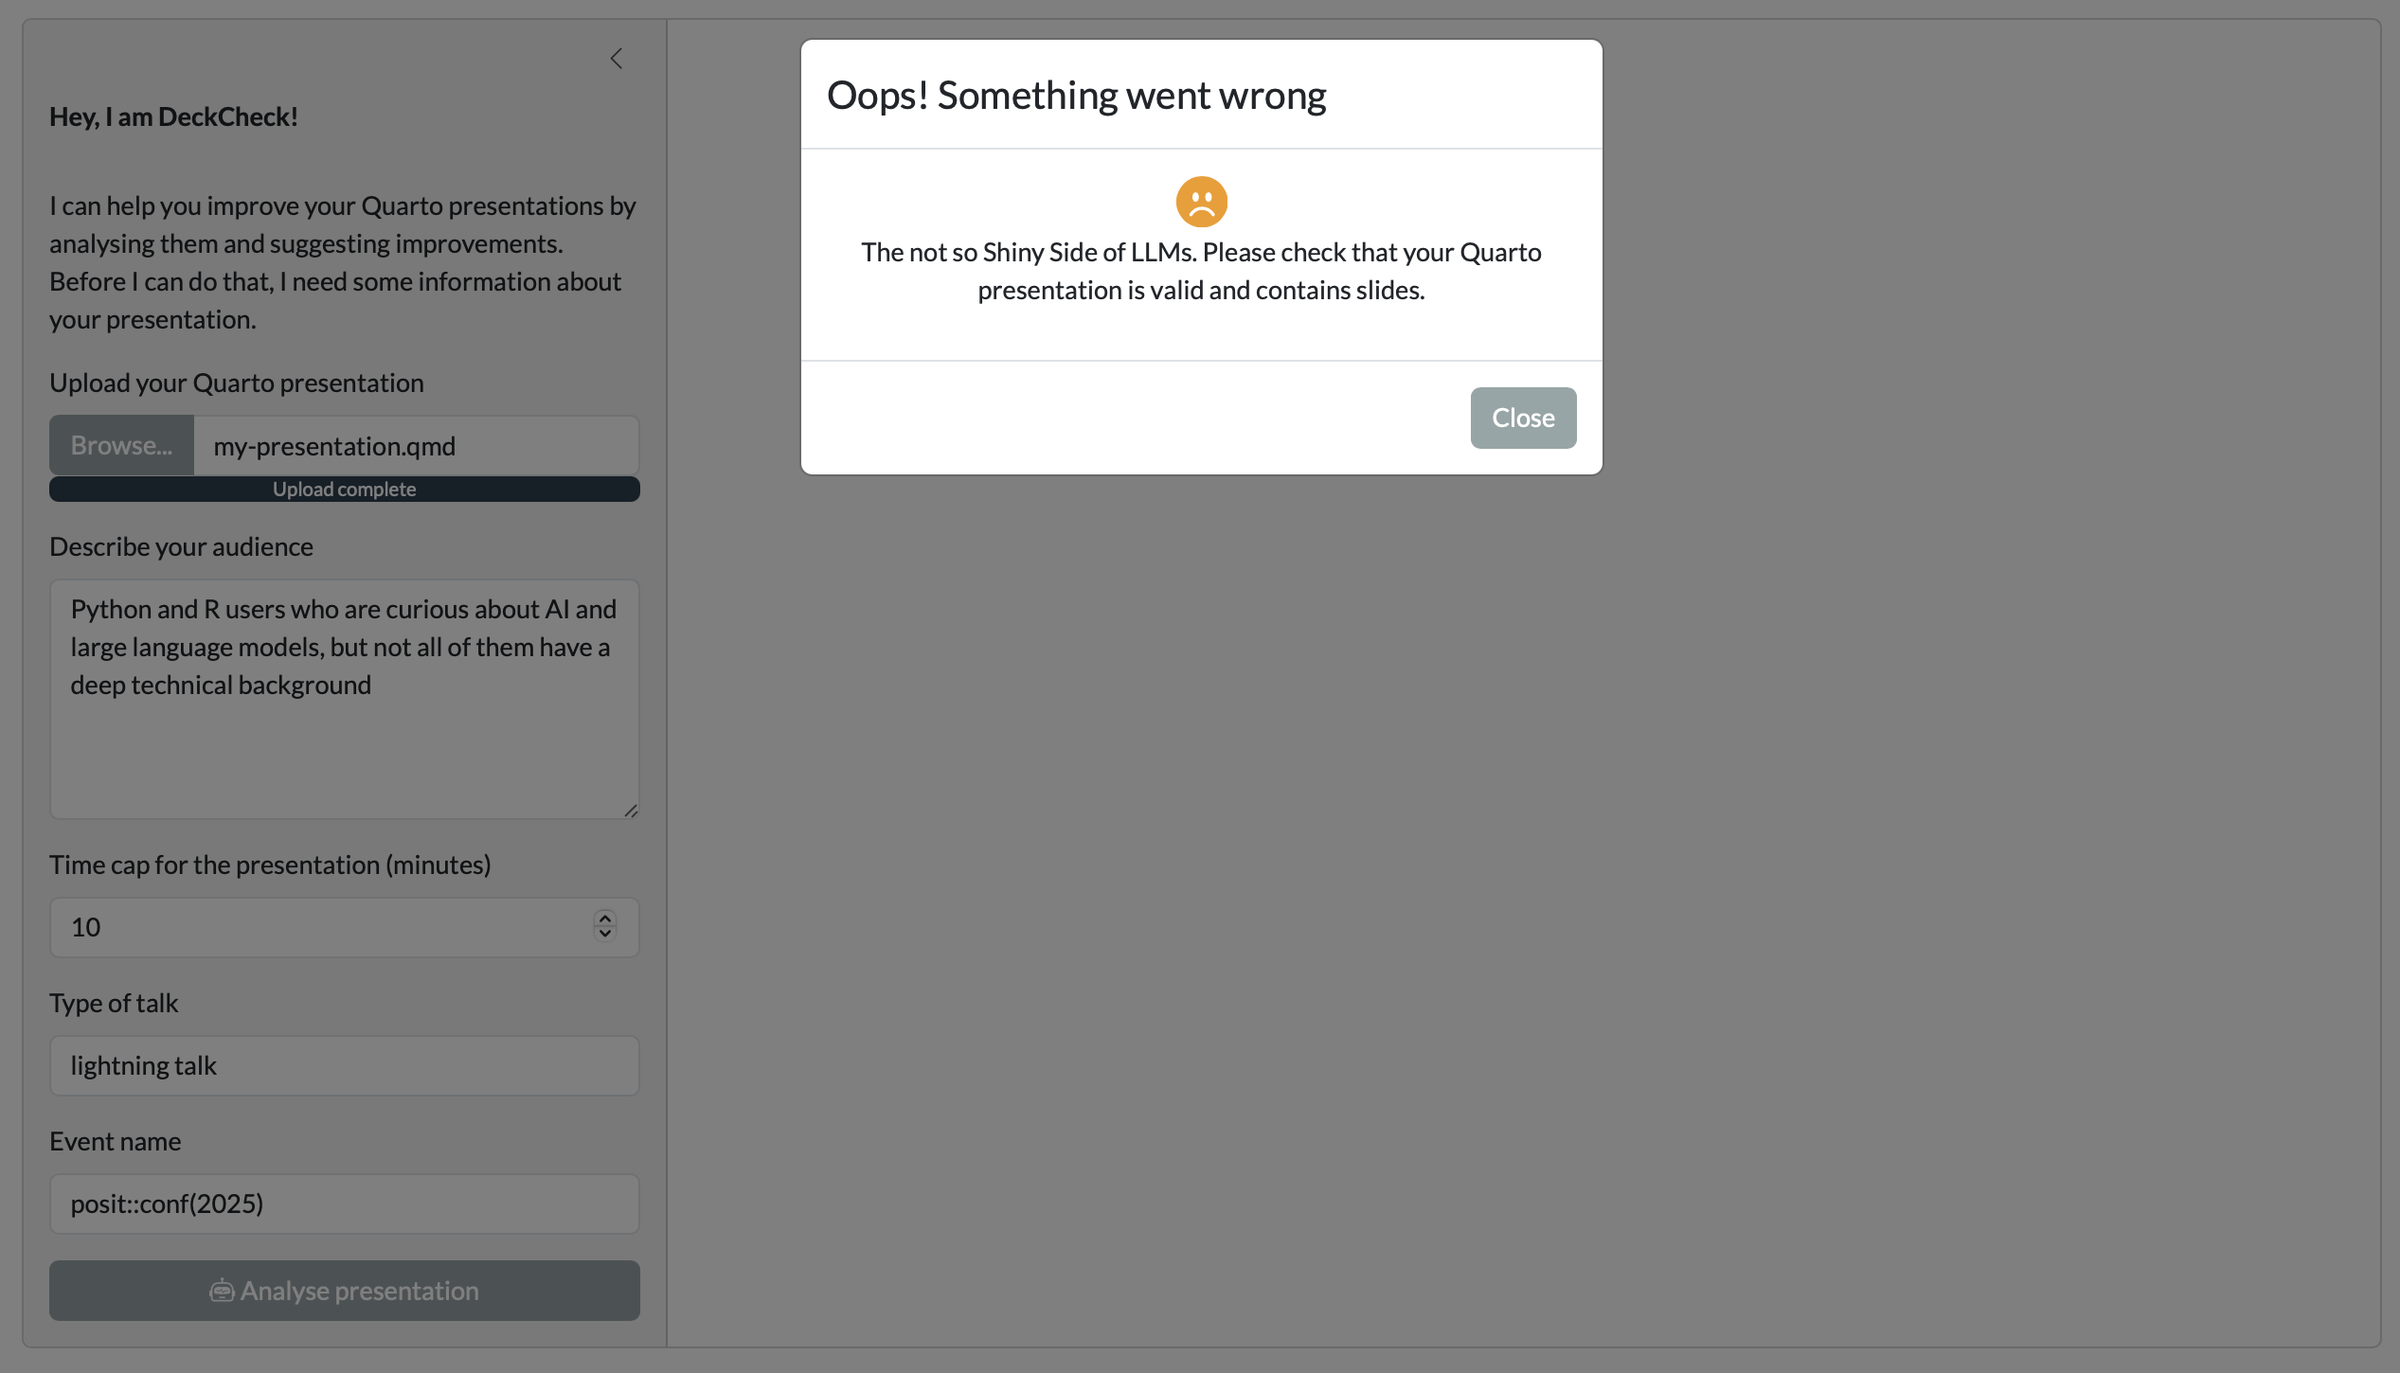
However, in a bespoke app like DeckCheck, where we’re streaming inside our own reactive expression or observer, you’ll want to think about setting up your own error handling. The idea is simple: don’t crash the app, and let the user know what went wrong in a friendly way. In our case, we split up our error messages: we can display one when something goes wrong with processing the Quarto file, and we can display one when our chat didn’t go as planned. These two error-catching “wrappers” serve as some inspiration for your next friendly error message.
Python#
To demonstrate what an error-catching “wrapper” could look like, let’s take a look at error handling for the chat task:
 1
 2
 3
 4
 5
 6
 7
 8
 9
10
11
12
13
14
15
16
17
18
19
20
21
22
23
24
25
26
27
28
29
30
31
32
33
34
35
36
|
@reactive.effect
def run_chat():
    # require quarto_task result to be available
    req(quarto_task.result() is not None)
    try:
        # Error for testing
        # raise ValueError("Test error")

        # ...

        # Trigger the chat task with the provided inputs
        chat_task.invoke(system_prompt, markdown_content, DeckAnalysis)

    except Exception as e:
        warnings.warn(f"Error when trying to invoke chat_task: {e}")

        # Print stack trace to the console
        traceback.print_exc()

        # Return value that triggers modal in UI
        m = ui.modal(
            ui.div(
                # Sad bootstrap icon
                ui.HTML(sad_icon),
                ui.br(),
                ui.p(
                    "The not so Shiny Side of LLMs. Unfortunately, chatting didn't work out. Do you have enough credits left?"
                ),
                # add class to center the content
                class_="text-center",
            ),
            title="Oops, something went wrong!",
            easy_close=True,
            footer=ui.modal_button("Close"),
        )
        ui.modal_show(m)
|
The same error handling gets applied to the Quarto task.
The Quarto task and the chat task chain together various tasks: copying an uploaded Quarto file, rendering it to Markdown and HTML, building a system prompt, and then invoking a conversation with an LLM. Any of these steps could fail (a bad upload, Quarto not rendering, the model returning something unexpected), but the try/except makes sure the app doesn’t just crash or leave the user hanging. Instead, if something goes wrong, it logs the error for debugging and then shows the user a clean modal with a simple message.
Error notifications
There’s also a nice helper for error notifications: shiny.types.NotifyException
. This is what ui.Chat from shinychat
uses for its error notifications. You can use it like this:
1
2
3
|
except Exception as e:
    msg = f"An error occurred: {e}"
    raise NotifyException(msg) from e
|
To demonstrate what an error-catching “wrapper” could look like, let’s take a look at error handling for the chat task:
 1
 2
 3
 4
 5
 6
 7
 8
 9
10
11
12
13
14
15
16
17
18
19
20
21
22
23
24
25
26
27
28
29
30
31
32
33
34
35
36
37
38
39
40
41
42
43
44
45
46
47
48
|
  observe({
    req(quarto_task$result())
    tryCatch(
      {
        # Error for testing
        # stop("This is a test error.")

        # ...

        # Trigger the chat task with the provided inputs
        chat_task$invoke(
          system_prompt = system_prompt,
          markdown_content = markdown_content,
          type_deck_analysis = type_deck_analysis
        )
      },
      error = function(e) {
        rlang::warn(paste(
          "Error when trying to invoke chat_task:",
          e$message
        ))

        # Print stack trace
        print(rlang::trace_back())

        # Show modal to the user
        showModal(
          modalDialog(
            title = "Oops! Something went wrong",
            div(
              class = "text-center",
              bsicons::bs_icon(
                "emoji-frown-fill",
                size = "2em",
                class = "text-warning"
              ),
              br(),
              p(
                "The not so Shiny Side of LLMs. Unfortunately, chatting didn't work out. Do you have enough credits left?"
              )
            ),
            easyClose = TRUE,
            footer = modalButton("Close")
          )
        )
      }
    )
  })
|
The same error handling gets applied to the Quarto task.
The Quarto task and the chat task chain together various tasks: copying an uploaded Quarto file, rendering it to Markdown and HTML, building a system prompt, and then invoking a conversation with an LLM. Any of these steps could fail (a bad upload, Quarto not rendering, the model returning something unexpected), but the tryCatch wrapper makes sure the app doesn’t just crash or leave the user hanging. Instead, if something goes wrong, it logs the error for debugging and then shows the user a clean modal with a simple message.
Note that the error messages just say “something went wrong” and a little direction as to what to do next. This is the cleanest and most “sanitised” way of handling errors. If you were to pass the real error message straight through to the modal, you’d risk showing users technical details they’re not supposed to see.
Oops, an error
The result() method of extended_task (Python) / ExtendedTask (R) can return "error" too. If there’s an error in the task, the error will be re-thrown if you call the result() method.
Custom CSS/Sass#
So far, we’ve been happily using a preset theme in our app (for DeckCheck: the Bootswatch Flatly theme). Nothing wrong with that, but maybe your organisation has a “house style” (company colours, logos, and fonts that need to be everywhere). The good news: Shiny doesn’t get in your way here. Under the hood, a Shiny app is still just HTML, CSS, and JavaScript. And just like any other web app, you can tweak the look and feel with CSS/Sass
until it matches whatever look you’re going for.
In Shiny, adding that CSS/Sass is easy. There are actually a few options:
- Inline CSS (global): you can attach CSS directly using a
<style> tag (tags.style() in Python or tags$style() in R) at the top of your UI. This is handy when you just need a couple of tweaks that apply globally. You can use it for CSS classes that you use throughout your app, or for things like global fonts. For simplicity, we’re going for this option in DeckCheck. Note that if you want to add add styles in the <head> specifically, you need ui.head_content() (Python) / tags$head() (R).
- Inline CSS (individual components): when you only need to tweak one particular element (e.g. center a particular element), you can append styles directly to that tag. In Python, you can call
.add_style()
on the tag itself. In R, you’d use tagAppendAttributes()
. Note that all HTML tags and a lot of UI components also support style and class arguments, so make sure to check out the documentation if you’re looking to make adjustments.
- External stylesheets: if your styles grow beyond a few lines, you’ll want to put it in a (S)CSS file inside the
www/ folder. Shiny will automatically serve that file, and you can include it with tags.link() / include_css() in Python or tags$link() / includeCSS() in R. This keeps your UI code clean and makes your styles easier to manage.
In DeckCheck, we add the styles of the .bounce class that we use for our bouncing robot
.
Python#
Custom CSS in Shiny
If you want to learn more about styling your app, check out Custom CSS in Shiny for Python
.
 1
 2
 3
 4
 5
 6
 7
 8
 9
10
11
12
13
14
15
16
17
18
19
20
21
22
23
24
25
26
27
|
app_ui = ui.page_fillable(
    ## General theme and styles
    ## 1. Custom CSS
    ui.tags.style("""
        .bounce {
            animation: bounce 2s infinite;
        }
        @keyframes bounce {
            0%, 100% {
                transform: translateY(0);
            }
            50% {
                transform: translateY(-20px);
            }
        }
    """),
    ui.layout_sidebar(
        ui.sidebar(
            ## Sidebar content
            ## ...
        ),
        ## Main content
        ## ...
    ),
    # Bootswatch theme
    theme=shinyswatch.theme.flatly,
)
|
Looking for more “high-level” styling? Check out brand.yml
for branding with a simple YAML file.
Custom CSS in Shiny
If you want to learn more about styling your app, check out Custom CSS in Shiny for R
.
 1
 2
 3
 4
 5
 6
 7
 8
 9
10
11
12
13
14
15
16
17
18
19
20
21
22
23
24
25
26
27
28
29
30
|
ui <- page_fillable(
  ## Options
  ## 1. Bootswatch theme
  theme = bs_theme(bootswatch = "flatly"),
  ## 2. Custom CSS
  tags$style(HTML(
    .bounce {
      animation: bounce 2s infinite;
    }
    @keyframes bounce {
      0%, 100% {
        transform: translateY(0);
      }
      50% {
        transform: translateY(-20px);
      }
    }
  "
  )),
  ## Layout
  layout_sidebar(
    ## Sidebar content
    sidebar = sidebar(
    ## Sidebar content
    ## ...
    ),
    ## Main content
      ## ...
  )
)
|
Note that these are fairly “low-level” techniques for achieving custom styling. To learn more about higher-level options you can take a look at theming
or brand.yml
.
The end result#
If we combine everything we talked about, we end up with a polished DeckCheck app! A sidebar layout with users inputs, a nice loading experience, non-blocking async operations, fancy looking graphs and tables, tooltips, you name it.
Python#
Get this code from GitHub
You can grab the code directly from here
.
See full app
  1
  2
  3
  4
  5
  6
  7
  8
  9
 10
 11
 12
 13
 14
 15
 16
 17
 18
 19
 20
 21
 22
 23
 24
 25
 26
 27
 28
 29
 30
 31
 32
 33
 34
 35
 36
 37
 38
 39
 40
 41
 42
 43
 44
 45
 46
 47
 48
 49
 50
 51
 52
 53
 54
 55
 56
 57
 58
 59
 60
 61
 62
 63
 64
 65
 66
 67
 68
 69
 70
 71
 72
 73
 74
 75
 76
 77
 78
 79
 80
 81
 82
 83
 84
 85
 86
 87
 88
 89
 90
 91
 92
 93
 94
 95
 96
 97
 98
 99
100
101
102
103
104
105
106
107
108
109
110
111
112
113
114
115
116
117
118
119
120
121
122
123
124
125
126
127
128
129
130
131
132
133
134
135
136
137
138
139
140
141
142
143
144
145
146
147
148
149
150
151
152
153
154
155
156
157
158
159
160
161
162
163
164
165
166
167
168
169
170
171
172
173
174
175
176
177
178
179
180
181
182
183
184
185
186
187
188
189
190
191
192
193
194
195
196
197
198
199
200
201
202
203
204
205
206
207
208
209
210
211
212
213
214
215
216
217
218
219
220
221
222
223
224
225
226
227
228
229
230
231
232
233
234
235
236
237
238
239
240
241
242
243
244
245
246
247
248
249
250
251
252
253
254
255
256
257
258
259
260
261
262
263
264
265
266
267
268
269
270
271
272
273
274
275
276
277
278
279
280
281
282
283
284
285
286
287
288
289
290
291
292
293
294
295
296
297
298
299
300
301
302
303
304
305
306
307
308
309
310
311
312
313
314
315
316
317
318
319
320
321
322
323
324
325
326
327
328
329
330
331
332
333
334
335
336
337
338
339
340
341
342
343
344
345
346
347
348
349
350
351
352
353
354
355
356
357
358
359
360
361
362
363
364
365
366
367
368
369
370
371
372
373
374
375
376
377
378
379
380
381
382
383
384
385
386
387
388
389
390
391
392
393
394
395
396
397
398
399
400
401
402
403
404
405
406
407
408
409
410
411
412
413
414
415
416
417
418
419
420
421
422
423
424
425
426
427
428
429
430
431
432
433
434
435
436
437
438
439
440
441
442
443
444
445
446
447
448
449
450
451
452
453
454
455
456
457
458
459
460
461
462
463
464
465
466
467
468
469
470
471
472
473
474
475
476
477
478
479
480
481
482
483
484
485
486
487
488
489
490
491
492
493
494
495
496
497
498
499
500
501
502
503
504
505
506
507
508
509
510
511
512
513
514
515
516
517
518
519
520
521
522
523
524
525
526
527
528
529
530
531
532
533
534
535
536
537
538
539
540
541
542
543
544
545
546
547
548
549
550
551
552
553
554
555
556
557
558
559
560
561
562
563
564
565
566
567
568
569
570
571
572
573
574
575
576
577
578
579
580
581
582
583
584
585
586
587
588
589
590
591
592
593
594
595
596
597
598
599
600
601
602
603
604
605
606
607
608
609
610
611
612
613
614
615
616
617
618
619
620
621
622
623
624
625
626
627
628
629
|
from shiny import App, reactive, render, ui, req
from shinywidgets import output_widget, render_widget
import shinyswatch
import pandas as pd
import plotly.express as px
from dotenv import load_dotenv
from chatlas import ChatAnthropic, interpolate_file, interpolate
from pathlib import Path
from pydantic import BaseModel, Field
from typing import Annotated, Optional, Union
import tempfile
import shutil
import asyncio
import warnings
import traceback
load_dotenv() # Loads key from the .env file
# Path to the current file
APP_DIR = Path(__file__).parent
# Root directory of the project
ROOT_DIR = APP_DIR.parent.parent
# ======================
# Data Structure
# ======================
ScoreType = Annotated[int, Field(ge=0, le=10)]
PercentType = Annotated[float, Field(ge=0.0, le=100.0)]
MinutesType = Annotated[int, Field(ge=0)]
SlideCount = Annotated[int, Field(ge=0)]
class ScoringCategory(BaseModel):
score: ScoreType = Field(..., description="Score from 1–10.")
justification: str = Field(..., description="Brief explanation of the score.")
improvements: Optional[str] = Field(
None,
description="Concise, actionable improvements, mentioning slide numbers if applicable.",
)
score_after_improvements: ScoreType = Field(
..., description="Estimated score after suggested improvements."
)
class DeckAnalysis(BaseModel):
presentation_title: str = Field(..., description="The presentation title.")
total_slides: SlideCount
percent_with_code: PercentType
percent_with_images: PercentType
estimated_duration_minutes: MinutesType
tone: str = Field(
..., description="Brief description of the tone of the presentation."
)
clarity: ScoringCategory = Field(
...,
description="Evaluate how clearly the ideas are communicated. Are the explanations easy to understand? Are terms defined when needed? Is the key message clear?",
)
relevance: ScoringCategory = Field(
...,
description="Assess how well the content matches the audience's background, needs, and expectations. Are examples, depth of detail, and terminology appropriate for the audience type?",
)
visual_design: ScoringCategory = Field(
...,
description="Judge the visual effectiveness of the slides. Are they readable, visually balanced, and not overcrowded with text or visuals? Is layout used consistently?",
)
engagement: ScoringCategory = Field(
...,
description="Estimate how likely the presentation is to keep attention. Are there moments of interactivity, storytelling, humor, or visual interest that invite focus?",
)
pacing: ScoringCategory = Field(
...,
description="Analyze the distribution of content across slides. Are some slides too dense or too light? ",
)
structure: ScoringCategory = Field(
...,
description="Review the logical flow of the presentation. Is there a clear beginning, middle, and end? Are transitions between topics smooth? Does the presentation build toward a conclusion?",
)
consistency: ScoringCategory = Field(
...,
description="Evaluatue whether the presentation is consistent when it comes to formatting, tone, and visual elements. Are there any elements that feel out of place?",
)
accessibility: ScoringCategory = Field(
...,
description="Consider how accessible the presentation would be for all viewers, including those with visual or cognitive challenges. Are font sizes readable? Is there sufficient contrast? Are visual elements not overwhelming?",
)
# ======================
# Tool definition
# ======================
def calculate_slide_metric(metric: str) -> Union[int, float]:
"""
Calculates the total number of slides, percentage of slides with code blocks,
and percentage of slides with images in a Quarto presentation HTML file.
Parameters
----------
metric : str
The metric to calculate: "total_slides" for total number of slides,
"code" for percentage of slides containing fenced code blocks,
or "images" for percentage of slides containing images.
Returns
-------
float or int
The calculated metric value.
"""
html_file = Path("./Quarto/docs/my-presentation.html")
if not html_file.exists():
raise FileNotFoundError(f"HTML file {html_file} does not exist.")
# Read HTML file
with open(html_file, "r", encoding="utf-8") as f:
html_content = f.read()
# Split on <section> tags to get individual slides
slides = html_content.split("<section")
total_slides = len(slides)
if metric == "total_slides":
result = total_slides
elif metric == "code":
slides_with_code = sum('class="sourceCode"' in slide for slide in slides)
result = round((slides_with_code / total_slides) * 100, 2)
elif metric == "images":
slides_with_image = sum("<img" in slide for slide in slides)
result = round((slides_with_image / total_slides) * 100, 2)
else:
raise ValueError("Unknown metric: choose 'total_slides', 'code', or 'images'")
return result
# ======================
# Data wrangling
# ======================
def make_frames(d: dict):
"""
Convert the dictionary returned by the LLM into a meta dictionary and
a DataFrame for the eval categories.
Parameters
----------
d : dict
The dictionary returned by the LLM.
Returns
-------
dict
A dictionary with two keys: "meta" and "evals". "meta" contains the
meta information as a dictionary, and "evals" contains a DataFrame with
the eval categories.
"""
meta_keys = [
"presentation_title",
"total_slides",
"percent_with_code",
"percent_with_images",
"estimated_duration_minutes",
"tone",
]
meta = {k: d[k] for k in meta_keys}
# eval categories (everything else)
evals = []
for k, v in d.items():
if k not in meta_keys:
# fix typo
evals.append(
{
"category": k,
"score": v["score"],
"justification": v["justification"],
"improvements": v["improvements"],
"score_after_improvements": v["score_after_improvements"],
}
)
evals_df = pd.DataFrame(evals)
return {"meta": meta, "evals": evals_df}
# ======================
# Tooltip helper
# ======================
def add_line_breaks(text, width=50):
if not isinstance(text, str):
return text
words = text.split()
lines = []
current_line = ""
for word in words:
# +1 accounts for the space if current_line isn't empty
if len(current_line) + len(word) + (1 if current_line else 0) <= width:
current_line += (" " if current_line else "") + word
else:
lines.append(current_line)
current_line = word
if current_line:
lines.append(current_line)
return "<br>".join(lines)
# ======================
# Icons
# ======================
# SVG icon copied from https://icons.getbootstrap.com/icons/file-slides-fill/
file_slides = """<svg xmlns="http://www.w3.org/2000/svg" fill="currentColor" class="bi bi-file-slides-fill" viewBox="0 0 16 16">
<path d="M7 7.78V5.22c0-.096.106-.156.19-.106l2.13 1.279a.125.125 0 0 1 0 .214l-2.13 1.28A.125.125 0 0 1 7 7.778z"/>
<path d="M12 0H4a2 2 0 0 0-2 2v12a2 2 0 0 0 2 2h8a2 2 0 0 0 2-2V2a2 2 0 0 0-2-2M5 4h6a.5.5 0 0 1 .496.438l.5 4A.5.5 0 0 1 11.5 9h-3v2.016c.863.055 1.5.251 1.5.484 0 .276-.895.5-2 .5s-2-.224-2-.5c0-.233.637-.429 1.5-.484V9h-3a.5.5 0 0 1-.496-.562l.5-4A.5.5 0 0 1 5 4"/>
</svg>"""
file_slides_loader = """<svg xmlns="http://www.w3.org/2000/svg" width="6em" height="6em" fill="currentColor" class="bi bi-file-slides bounce" viewBox="0 0 16 16">
<path d="M5 4a.5.5 0 0 0-.496.438l-.5 4A.5.5 0 0 0 4.5 9h3v2.016c-.863.055-1.5.251-1.5.484 0 .276.895.5 2 .5s2-.224 2-.5c0-.233-.637-.429-1.5-.484V9h3a.5.5 0 0 0 .496-.562l-.5-4A.5.5 0 0 0 11 4zm2 3.78V5.22c0-.096.106-.156.19-.106l2.13 1.279a.125.125 0 0 1 0 .214l-2.13 1.28A.125.125 0 0 1 7 7.778z"/>
<path d="M2 2a2 2 0 0 1 2-2h8a2 2 0 0 1 2 2v12a2 2 0 0 1-2 2H4a2 2 0 0 1-2-2zm10-1H4a1 1 0 0 0-1 1v12a1 1 0 0 0 1 1h8a1 1 0 0 0 1-1V2a1 1 0 0 0-1-1"/>
</svg>"""
# SVG icon copied from https://icons.getbootstrap.com/icons/file-code-fill/
file_code = """<svg xmlns="http://www.w3.org/2000/svg" fill="currentColor" class="bi bi-file-code-fill" viewBox="0 0 16 16">
<path d="M12 0H4a2 2 0 0 0-2 2v12a2 2 0 0 0 2 2h8a2 2 0 0 0 2-2V2a2 2 0 0 0-2-2M6.646 5.646a.5.5 0 1 1 .708.708L5.707 8l1.647 1.646a.5.5 0 0 1-.708.708l-2-2a.5.5 0 0 1 0-.708zm2.708 0 2 2a.5.5 0 0 1 0 .708l-2 2a.5.5 0 0 1-.708-.708L10.293 8 8.646 6.354a.5.5 0 1 1 .708-.708"/>
</svg>"""
# SVG icon copied from https://icons.getbootstrap.com/icons/file-image-fill/
file_image = """<svg xmlns="http://www.w3.org/2000/svg" fill="currentColor" class="bi bi-file-image-fill" viewBox="0 0 16 16">
<path d="M4 0h8a2 2 0 0 1 2 2v8.293l-2.73-2.73a1 1 0 0 0-1.52.127l-1.889 2.644-1.769-1.062a1 1 0 0 0-1.222.15L2 12.292V2a2 2 0 0 1 2-2m4.002 5.5a1.5 1.5 0 1 0-3 0 1.5 1.5 0 0 0 3 0"/>
<path d="M10.564 8.27 14 11.708V14a2 2 0 0 1-2 2H4a2 2 0 0 1-2-2v-.293l3.578-3.577 2.56 1.536 2.426-3.395z"/>
</svg>"""
# SVG icon copied from https://icons.getbootstrap.com/icons/robot/
robot = """<svg xmlns="http://www.w3.org/2000/svg" width="16" height="16" fill="currentColor" class="bi bi-robot" viewBox="0 0 16 16">
<path d="M6 12.5a.5.5 0 0 1 .5-.5h3a.5.5 0 0 1 0 1h-3a.5.5 0 0 1-.5-.5M3 8.062C3 6.76 4.235 5.765 5.53 5.886a26.6 26.6 0 0 0 4.94 0C11.765 5.765 13 6.76 13 8.062v1.157a.93.93 0 0 1-.765.935c-.845.147-2.34.346-4.235.346s-3.39-.2-4.235-.346A.93.93 0 0 1 3 9.219zm4.542-.827a.25.25 0 0 0-.217.068l-.92.9a25 25 0 0 1-1.871-.183.25.25 0 0 0-.068.495c.55.076 1.232.149 2.02.193a.25.25 0 0 0 .189-.071l.754-.736.847 1.71a.25.25 0 0 0 .404.062l.932-.97a25 25 0 0 0 1.922-.188.25.25 0 0 0-.068-.495c-.538.074-1.207.145-1.98.189a.25.25 0 0 0-.166.076l-.754.785-.842-1.7a.25.25 0 0 0-.182-.135"/>
<path d="M8.5 1.866a1 1 0 1 0-1 0V3h-2A4.5 4.5 0 0 0 1 7.5V8a1 1 0 0 0-1 1v2a1 1 0 0 0 1 1v1a2 2 0 0 0 2 2h10a2 2 0 0 0 2-2v-1a1 1 0 0 0 1-1V9a1 1 0 0 0-1-1v-.5A4.5 4.5 0 0 0 10.5 3h-2zM14 7.5V13a1 1 0 0 1-1 1H3a1 1 0 0 1-1-1V7.5A3.5 3.5 0 0 1 5.5 4h5A3.5 3.5 0 0 1 14 7.5"/>
</svg>"""
robot_loader = """<svg xmlns="http://www.w3.org/2000/svg" width="6em" height="6em" fill="currentColor" class="bi bi-robot text-primary bounce" viewBox="0 0 16 16">
<path d="M6 12.5a.5.5 0 0 1 .5-.5h3a.5.5 0 0 1 0 1h-3a.5.5 0 0 1-.5-.5M3 8.062C3 6.76 4.235 5.765 5.53 5.886a26.6 26.6 0 0 0 4.94 0C11.765 5.765 13 6.76 13 8.062v1.157a.93.93 0 0 1-.765.935c-.845.147-2.34.346-4.235.346s-3.39-.2-4.235-.346A.93.93 0 0 1 3 9.219zm4.542-.827a.25.25 0 0 0-.217.068l-.92.9a25 25 0 0 1-1.871-.183.25.25 0 0 0-.068.495c.55.076 1.232.149 2.02.193a.25.25 0 0 0 .189-.071l.754-.736.847 1.71a.25.25 0 0 0 .404.062l.932-.97a25 25 0 0 0 1.922-.188.25.25 0 0 0-.068-.495c-.538.074-1.207.145-1.98.189a.25.25 0 0 0-.166.076l-.754.785-.842-1.7a.25.25 0 0 0-.182-.135"/>
<path d="M8.5 1.866a1 1 0 1 0-1 0V3h-2A4.5 4.5 0 0 0 1 7.5V8a1 1 0 0 0-1 1v2a1 1 0 0 0 1 1v1a2 2 0 0 0 2 2h10a2 2 0 0 0 2-2v-1a1 1 0 0 0 1-1V9a1 1 0 0 0-1-1v-.5A4.5 4.5 0 0 0 10.5 3h-2zM14 7.5V13a1 1 0 0 1-1 1H3a1 1 0 0 1-1-1V7.5A3.5 3.5 0 0 1 5.5 4h5A3.5 3.5 0 0 1 14 7.5"/>
</svg>"""
# SVG icon copied from https://icons.getbootstrap.com/icons/emoji-frown-fill/
sad_icon = """<svg xmlns="http://www.w3.org/2000/svg" width="32" height="32" fill="currentColor" class="bi bi-emoji-frown-fill text-warning" viewBox="0 0 16 16">
<path d="M8 16A8 8 0 1 0 8 0a8 8 0 0 0 0 16M7 6.5C7 7.328 6.552 8 6 8s-1-.672-1-1.5S5.448 5 6 5s1 .672 1 1.5m-2.715 5.933a.5.5 0 0 1-.183-.683A4.5 4.5 0 0 1 8 9.5a4.5 4.5 0 0 1 3.898 2.25.5.5 0 0 1-.866.5A3.5 3.5 0 0 0 8 10.5a3.5 3.5 0 0 0-3.032 1.75.5.5 0 0 1-.683.183M10 8c-.552 0-1-.672-1-1.5S9.448 5 10 5s1 .672 1 1.5S10.552 8 10 8"/>
</svg>"""
# ======================
# Shiny App
# ======================
app_ui = ui.page_fillable(
## General theme and styles
## 1. Custom CSS
ui.tags.style("""
.bounce {
animation: bounce 2s infinite;
}
@keyframes bounce {
0%, 100% {
transform: translateY(0);
}
50% {
transform: translateY(-20px);
}
}
"""),
ui.layout_sidebar(
ui.sidebar(
## Sidebar content
ui.div(
ui.p(ui.strong("Hey, I am DeckCheck!")),
ui.p(
"""I can help you improve your Quarto presentations by analysing them and suggesting improvements. Before I can do that, I need some information about your presentation."""
),
),
ui.input_file(
"file",
"Upload your Quarto presentation",
accept=[".qmd", ".qmdx"],
multiple=False,
),
ui.input_text_area(
"audience",
"Describe your audience",
height="150px",
placeholder="e.g. Python and R users who are curious about AI and large language models, but not all of them have a deep technical background",
),
ui.input_numeric(
"length", "Time cap for the presentation (minutes)", value=10, min=1
),
ui.input_text(
"type",
"Type of talk",
placeholder="e.g. lightning talk, workshop, or keynote",
),
ui.input_text("event", "Event name", placeholder="e.g. posit::conf(2025)"),
ui.input_task_button(
"submit",
icon=ui.HTML(robot),
label="Analyse presentation",
),
width=400,
),
## Main content
ui.output_ui("results"),
),
# Bootswatch theme
theme=shinyswatch.theme.flatly,
)
def server(input, output, session):
@ui.bind_task_button(button_id="submit")
@reactive.extended_task
async def quarto_task(file_path, temp_dir):
# We're using an Extended Task to avoid blocking. Note that
# a temporary directory called within mirai will be
# different from the one in the "main" Shiny session. Hence,
# we pass a temp_dir parameter to the task and use that.
qmd_file = Path(temp_dir) / "my-presentation.qmd"
shutil.copy(file_path, qmd_file)
# Run asyncio subprocess
proc = await asyncio.create_subprocess_exec(
"quarto", "render", str(qmd_file), "--to", "markdown,html"
)
await proc.communicate()
# Return the path to the markdown file
return Path(temp_dir) / "my-presentation.md"
@ui.bind_task_button(button_id="submit")
@reactive.extended_task
async def chat_task(system_prompt, markdown_content, DeckAnalysis):
# We're using an extended task to avoid blocking the session and
# we start a fresh chat session each time.
# For a feedback loop, we would use a persistent chat session.
chat = ChatAnthropic(
model="claude-sonnet-4-20250514",
system_prompt=system_prompt,
)
# Set model parameters (optional)
chat.set_model_params(
temperature=0.8, # default is 1
)
# Register the tool with the chat
chat.register_tool(calculate_slide_metric)
# Start conversation with the chat
# Task 1: regular chat to extract meta-data
chat_res1 = await chat.chat_async(
interpolate(
"Execute Task 1 (counts). Here are the slides in Markdown: {{ markdown_content }}"
)
)
print(chat_res1)
# Task 2: structured chat to further analyse the slides
chat_res2 = await chat.chat_structured_async(
"Execute Task 2 (suggestions)",
data_model=DeckAnalysis,
)
return chat_res2
@reactive.effect
@reactive.event(input.submit)
async def run_quarto():
req(input.file() is not None)
try:
# Error for testing
# raise ValueError("Test error")
# Get file path of the uploaded file
file_path = input.file()[0]["datapath"]
quarto_task.invoke(file_path, tempfile.gettempdir())
except Exception as e:
warnings.warn(f"Error when trying to invoke quarto_task: {e}")
# Print stack trace to the console
traceback.print_exc()
# Return value that triggers modal in UI
m = ui.modal(
ui.div(
# Sad bootstrap icon
ui.HTML(sad_icon),
ui.br(),
ui.p(
"The not so Shiny Side of LLMs. Please check that your Quarto presentation is valid and contains slides."
),
# add class to center the content
class_="text-center",
),
title="Oops, something went wrong!",
easy_close=True,
footer=ui.modal_button("Close"),
)
ui.modal_show(m)
@reactive.effect
def run_chat():
# require quarto_task result to be available
req(quarto_task.result() is not None)
try:
# Error for testing
# raise ValueError("Test error")
# Get the Markdown file path from the complete quarto_task
markdown_file = quarto_task.result()
# Read the generated Markdown file containing the slides
markdown_content = markdown_file.read_text(encoding="utf-8")
# Define prompt file
system_prompt_file = (
ROOT_DIR / "prompts" / "prompt-analyse-slides-structured-tool.md"
)
# Create system prompt
system_prompt = interpolate_file(
system_prompt_file,
variables={
"audience": input.audience(),
"length": input.length(),
"type": input.type(),
"event": input.event(),
"markdown_content": markdown_content,
},
)
# Trigger the chat task with the provided inputs
chat_task.invoke(system_prompt, markdown_content, DeckAnalysis)
except Exception as e:
warnings.warn(f"Error when trying to invoke chat_task: {e}")
# Print stack trace to the console
traceback.print_exc()
# Return value that triggers modal in UI
m = ui.modal(
ui.div(
# Sad bootstrap icon
ui.HTML(sad_icon),
ui.br(),
ui.p(
"The not so Shiny Side of LLMs. Unfortunately, chatting didn't work out. Do you have enough credits left?"
),
# add class to center the content
class_="text-center",
),
title="Oops, something went wrong!",
easy_close=True,
footer=ui.modal_button("Close"),
)
ui.modal_show(m)
@reactive.calc
def analysis_result():
res = chat_task.result()
if res is not None:
return make_frames(res)
else:
return None
@render.ui
async def results():
if quarto_task.status() == "running":
return ui.div(
ui.HTML(file_slides_loader),
ui.br(),
ui.p("Processing your Quarto presentation..."),
class_="text-center d-flex flex-column justify-content-center align-items-center",
style="height: 100%",
)
elif chat_task.status() == "running":
return ui.div(
ui.HTML(robot_loader),
ui.br(),
ui.p("The LLM is doing its magic..."),
class_="text-center d-flex flex-column justify-content-center align-items-center",
style="height: 100%",
)
elif chat_task.status() == "success":
return ui.TagList(
ui.layout_column_wrap(
ui.tooltip(
ui.value_box(
"Showtime",
ui.output_text("showtime"),
showcase=ui.HTML(file_slides),
theme="primary",
),
"Slides are being counted based on the provided Quarto presentation, then an educated guess is made about the time it will take to present them.",
),
ui.tooltip(
ui.value_box(
"Code Savviness",
ui.output_text("code_savviness"),
showcase=ui.HTML(file_code),
theme="primary",
),
"Code Saviness is calculated based on the slides that contain code chunks. The percentage is the ratio of those slides to total slides.",
),
ui.tooltip(
ui.value_box(
"Image Presence",
ui.output_text("image_presence"),
showcase=ui.HTML(file_image),
theme="primary",
),
"Image Presence is calculated based on the slides that contain images. The percentage is the ratio of those slides to total slides.",
),
width=1 / 3,
fill=False,
),
ui.layout_column_wrap(
ui.card(
ui.card_header(ui.strong("Scores per category")),
output_widget("scores"),
height="600px",
),
ui.card(
ui.card_header(
ui.strong("Suggested improvements per category")
),
ui.output_data_frame("suggested_improvements"),
height="600px",
),
width=1 / 2,
fill=False,
),
)
@render_widget
def scores():
res = analysis_result()
req(res is not None)
evals = res["evals"].copy()
evals = evals.sort_values("score")
evals["category"] = pd.Categorical(
evals["category"], categories=evals["category"], ordered=True
)
# apply to the justification column
evals["justification_wrapped"] = evals["justification"].apply(add_line_breaks)
# Create a custom tooltip column
evals["tooltip"] = (
"Score: "
+ evals["score"].astype(str)
+ "<br>After improvements: "
+ evals["score_after_improvements"].astype(str)
+ "<br>Justification: "
+ evals["justification_wrapped"]
)
plot = px.bar(
evals,
x="score",
y="category",
orientation="h",
labels={"category": "Category", "score": "Score"},
hover_data={"tooltip": True}, # include the tooltip column
)
# Set hovertemplate to use our custom tooltip
plot.update_traces(
hovertemplate="%{customdata[0]}<extra></extra>",
customdata=evals[["tooltip"]].values,
)
plot.update_traces(marker_color="#18bc9c")
plot.update_layout(template="simple_white")
return plot
@render.data_frame
def suggested_improvements():
res = analysis_result()
req(res is not None)
evals = res["evals"].copy()
evals["Gain"] = evals["score_after_improvements"] - evals["score"]
result_table = evals.assign(
Category=evals["category"],
**{"Current score": evals["score"]},
Improvements=evals["improvements"],
**{"Score After Improvements": evals["score_after_improvements"]},
Gain=evals["Gain"],
)[
[
"Category",
"Current score",
"Improvements",
"Score After Improvements",
"Gain",
]
].sort_values("Gain", ascending=False)
return result_table
@render.text
def showtime():
res = analysis_result()
req(res is not None)
return f"{res['meta']['estimated_duration_minutes']} minutes"
@render.text
def code_savviness():
res = analysis_result()
req(res is not None)
return f"{res['meta']['percent_with_code']} %"
@render.text
def image_presence():
res = analysis_result()
req(res is not None)
return f"{res['meta']['percent_with_images']} %"
app = App(app_ui, server)
|
Get this code from GitHub
You can grab the code directly from here
.
See full app
  1
  2
  3
  4
  5
  6
  7
  8
  9
 10
 11
 12
 13
 14
 15
 16
 17
 18
 19
 20
 21
 22
 23
 24
 25
 26
 27
 28
 29
 30
 31
 32
 33
 34
 35
 36
 37
 38
 39
 40
 41
 42
 43
 44
 45
 46
 47
 48
 49
 50
 51
 52
 53
 54
 55
 56
 57
 58
 59
 60
 61
 62
 63
 64
 65
 66
 67
 68
 69
 70
 71
 72
 73
 74
 75
 76
 77
 78
 79
 80
 81
 82
 83
 84
 85
 86
 87
 88
 89
 90
 91
 92
 93
 94
 95
 96
 97
 98
 99
100
101
102
103
104
105
106
107
108
109
110
111
112
113
114
115
116
117
118
119
120
121
122
123
124
125
126
127
128
129
130
131
132
133
134
135
136
137
138
139
140
141
142
143
144
145
146
147
148
149
150
151
152
153
154
155
156
157
158
159
160
161
162
163
164
165
166
167
168
169
170
171
172
173
174
175
176
177
178
179
180
181
182
183
184
185
186
187
188
189
190
191
192
193
194
195
196
197
198
199
200
201
202
203
204
205
206
207
208
209
210
211
212
213
214
215
216
217
218
219
220
221
222
223
224
225
226
227
228
229
230
231
232
233
234
235
236
237
238
239
240
241
242
243
244
245
246
247
248
249
250
251
252
253
254
255
256
257
258
259
260
261
262
263
264
265
266
267
268
269
270
271
272
273
274
275
276
277
278
279
280
281
282
283
284
285
286
287
288
289
290
291
292
293
294
295
296
297
298
299
300
301
302
303
304
305
306
307
308
309
310
311
312
313
314
315
316
317
318
319
320
321
322
323
324
325
326
327
328
329
330
331
332
333
334
335
336
337
338
339
340
341
342
343
344
345
346
347
348
349
350
351
352
353
354
355
356
357
358
359
360
361
362
363
364
365
366
367
368
369
370
371
372
373
374
375
376
377
378
379
380
381
382
383
384
385
386
387
388
389
390
391
392
393
394
395
396
397
398
399
400
401
402
403
404
405
406
407
408
409
410
411
412
413
414
415
416
417
418
419
420
421
422
423
424
425
426
427
428
429
430
431
432
433
434
435
436
437
438
439
440
441
442
443
444
445
446
447
448
449
450
451
452
453
454
455
456
457
458
459
460
461
462
463
464
465
466
467
468
469
470
471
472
473
474
475
476
477
478
479
480
481
482
483
484
485
486
487
488
489
490
491
492
493
494
495
496
497
498
499
500
501
502
503
504
505
506
507
508
509
510
511
512
513
514
515
516
517
518
519
520
521
522
523
524
525
526
527
528
529
530
531
532
533
534
535
536
537
538
539
540
541
542
543
544
545
546
547
548
549
550
551
552
553
554
555
556
557
558
559
560
561
562
563
564
565
566
567
568
569
570
571
572
573
574
575
576
577
578
579
580
581
582
583
584
585
586
587
588
589
590
591
592
593
594
595
596
597
598
599
600
601
602
603
604
605
606
607
608
609
610
611
612
613
614
615
616
617
618
619
620
621
622
623
624
625
626
627
628
629
630
631
632
633
634
635
636
637
638
639
640
641
642
643
644
645
646
647
648
649
|
library(shiny)
library(bslib)
library(ellmer)
library(mirai)
library(ggplot2)
library(ggiraph)
library(gdtools)
library(purrr)
library(dplyr)

# ======================
# Data Structure
# ======================
# Reusable scoring category
type_scoring_category <- type_object(
  score = type_integer(
    description = "Score from 1 to 10."
  ),
  justification = type_string(
    description = "Brief explanation of the score."
  ),
  improvements = type_string(
    description = "Concise, actionable improvements, mentioning slide numbers if applicable.",
    required = FALSE
  ),
  score_after_improvements = type_integer(
    description = "Estimated score after suggested improvements."
  )
)

# Top-level deck analysis object
type_deck_analysis <- type_object(
  presentation_title = type_string(description = "The presentation title."),
  total_slides = type_integer(description = "Total number of slides."),
  percent_with_code = type_number(
    description = "Percentage of slides containing code blocks (0–100)."
  ),
  percent_with_images = type_number(
    description = "Percentage of slides containing images (0–100)."
  ),
  estimated_duration_minutes = type_integer(
    description = "Estimated presentation length in minutes, assuming ~1 minute per text slide and 2–3 minutes per code or image-heavy slide."
  ),
  tone = type_string(
    description = "Brief description of the presentation tone (e.g., informal, technical, playful)."
  ),
  clarity = type_array(
    description = "Evaluate how clearly the ideas are communicated. Are the explanations easy to understand? Are terms defined when needed? Is the key message clear?",
    type_scoring_category
  ),
  relevance = type_array(
    description = "Asses how well the content matches the audience's background, needs, and expectations. Are examples, depth of detail, and terminology appropriate for the audience type?",
    type_scoring_category
  ),
  visual_design = type_array(
    description = "Judge the visual effectiveness of the slides. Are they readable, visually balanced, and not overcrowded with text or visuals? Is layout used consistently?",
    type_scoring_category
  ),
  engagement = type_array(
    description = "Estimate how likely the presentation is to keep attention. Are there moments of interactivity, storytelling, humor, or visual interest that invite focus?",
    type_scoring_category
  ),
  pacing = type_array(
    description = "Analyze the distribution of content across slides. Are some slides too dense or too light? ",
    type_scoring_category
  ),
  structure = type_array(
    description = "Review the logical flow of the presentation. Is there a clear beginning, middle, and end? Are transitions between topics smooth? Does the presentation build toward a conclusion?",
    type_scoring_category
  ),
  consistency = type_array(
    description = "Evaluate whether the presentation is consistent when it comes to formatting, tone, and visual elements. Are there any elements that feel out of place?",
    type_scoring_category
  ),
  accessibility = type_array(
    description = "Consider how accessible the presentation would be for all viewers, including those with visual or cognitive challenges. Are font sizes readable? Is there sufficient contrast? Are visual elements not overwhelming?",
    type_scoring_category
  )
)

# ======================
# Tool definition
# ======================
#' Calculates the total number of slides, percentage of slides with code blocks,
#' and percentage of slides with images in a Quarto presentation HTML file.
#'
#' @param metric The metric to calculate: "total_slides" for total number of slides,
#' "code" for percentage of slides containing fenced code blocks, or "images"
#' for percentage of slides containing images.
#' @return The calculated metric value.
calculate_slide_metric <- function(metric) {
  html_file <- paste0(tempdir(), "/my-presentation.html")
  if (!file.exists(html_file)) {
    stop(
      "HTML file does not exist. Please render your Quarto presentation first."
    )
  }
  # Read HTML file
  html_content <- readChar(html_file, file.size(html_file))

  # Split on <section> tags to get individual slides
  slides <- unlist(strsplit(html_content, "<section"))

  total_slides <- length(slides)

  if (metric == "total_slides") {
    result <- total_slides
  } else if (metric == "code") {
    # Count slides where we see the "sourceCode" class
    slides_with_code <- sum(grepl('class="sourceCode"', slides))
    result <- round((slides_with_code / total_slides) * 100, 2)
  } else if (metric == "images") {
    # Count slides with image tag
    slides_with_image <- sum(grepl('<img', slides))
    result <- round((slides_with_image / total_slides) * 100, 2)
  } else {
    stop("Unknown metric: choose 'total_slides', 'code', or 'images'")
  }

  return(result)
}

# Optionally, to avoid manual work:
# create_tool_def(calculate_slide_metric)
calculate_slide_metric <- tool(
  calculate_slide_metric,
  "Returns the calculated metric value",
  metric = type_string(
    'The metric to calculate: "total_slides" for total number of slides,
      "code" for percentage of slides containing fenced code blocks, or "images"
      for percentage of slides containing images.',
    required = TRUE
  )
)

# ======================
# Data wrangling
# ======================
#' Convert named list to tidy data frames
#'
#' @param named_list Named list as returned by the chat
#' @return List of two tibbles: meta and evals
make_frames <- function(named_list) {
  meta <- tibble(
    presentation_title = named_list$presentation_title,
    total_slides = named_list$total_slides,
    percent_with_code = named_list$percent_with_code,
    percent_with_images = named_list$percent_with_images,
    estimated_duration_minutes = named_list$estimated_duration_minutes,
    tone = named_list$tone
  )

  # Evaluation sections (clarity, relevance, etc.)
  eval_sections <- c(
    "clarity",
    "relevance",
    "visual_design",
    "engagement",
    "pacing",
    "structure",
    "consistency",
    "accessibility"
  )

  evals <- map_dfr(eval_sections, function(section) {
    as_tibble(named_list[[section]][[1]]) %>%
      mutate(
        category = section,
        .before = 1
      )
  })

  # Final tidy data frame
  final <- list(
    meta = meta,
    evals = evals
  )
}

# ======================
# Other helpers
# ======================
# Register Monteserrat font
register_gfont("Lato")

# ======================
# Shiny App
# ======================
ui <- page_fillable(
  ## Options
  ## Busy indication is enabled by default for UI created with bslib (which we use here),
  ## but must be enabled otherwise with useBusyIndicators().
  ## useBusyIndicators(),
  ## General theme and styles
  ## 1. Bootswatch theme
  theme = bs_theme(bootswatch = "flatly"),
  ## 2. Custom CSS
  tags$style(HTML(
    "
    .bounce {
      animation: bounce 2s infinite;
    }
    @keyframes bounce {
      0%, 100% {
        transform: translateY(0);
      }
      50% {
        transform: translateY(-20px);
      }
    }
  "
  )),
  ## Layout
  layout_sidebar(
    ## Sidebar content
    sidebar = sidebar(
      width = 400,
      # Open sidebar on mobile devices and show above content
      open = list(mobile = "always-above"),
      strong(p("Hey, I am DeckCheck!")),
      p(
        "I can help you improve your Quarto presentations by analysing them and suggesting improvements.
      Before I can do that, I need some information about your presentation."
      ),
      fileInput(
        inputId = "file",
        label = "Upload your Quarto presentation",
        accept = c(".qmd", ".qmdx")
      ),
      textAreaInput(
        inputId = "audience",
        height = "150px",
        label = "Describe your audience",
        placeholder = "e.g. Python and R users who are curious about AI and large language models, but not all of them have a deep technical background"
      ),
      numericInput(
        inputId = "length",
        label = "Time cap for the presentation (minutes)",
        value = 10
      ),
      textInput(
        inputId = "type",
        label = "Type of talk",
        placeholder = "e.g. lightning talk, workshop, or keynote"
      ),
      textInput(
        inputId = "event",
        label = "Event name",
        placeholder = "e.g. posit::conf(2025)"
      ),
      input_task_button(
        id = "submit",
        label = shiny::tagList(
          bsicons::bs_icon("robot"),
          "Analyse presentation"
        ),
        label_busy = "DeckCheck is checking...",
        type = "default"
      )
    ),
    ## Main content
    uiOutput("results", height = "100%")
  )
)

server <- function(input, output, session) {
  quarto_task <- ExtendedTask$new(function(file_path, temp_dir) {
    # We're using an Extended Task to avoid blocking. Note that
    # a temporary directory called within mirai will be
    # different from the one in the "main" Shiny session. Hence,
    # we pass a temp_dir parameter to the task and use that.
    mirai(
      {
        qmd_file <- file.path(temp_dir, "my-presentation.qmd")
        file.copy(file_path, qmd_file, overwrite = TRUE)

        quarto::quarto_render(
          input = qmd_file,
          output_format = c("markdown", "html")
        )

        # Return the path to the markdown file
        file.path(temp_dir, "my-presentation.md")
      },
      # Use the same environment as the Shiny app
      environment()
    )
  }) |>
    bind_task_button("submit")

  chat_task <- ExtendedTask$new(function(
    system_prompt,
    markdown_content,
    type_deck_analysis
  ) {
    # We're using an Extended Task to avoid blocking the session and
    # we start a fresh chat session each time.
    # For a feedback loop, we would use a persistent chat session.
    chat <- chat_anthropic(
      model = "claude-sonnet-4-20250514",
      system_prompt = system_prompt,
      params = params(
        temperature = 0.8 # default is 1
      )
    )

    # Register the tool with the chat
    chat$register_tool(calculate_slide_metric)

    # Start conversation with the chat
    # Task 1: regular chat to extract meta-data
    chat_res <- chat$chat_async(
      interpolate(
        "Execute Task 1 (counts). Here are the slides in Markdown: {{ markdown_content }}"
      )
    )

    chat_res$then(function(res) {
      # Print the response from Task 1
      cat("Response from Task 1:\n")
      cat(res, "\n\n")

      # Execute next task
      # Task 2: structured chat to further analyse the slides
      chat$chat_structured_async(
        "Execute Task 2 (suggestions)",
        type = type_deck_analysis
      )
    })
  }) |>
    bind_task_button("submit")

  observe({
    req(input$file)
    req(input$audience)
    req(input$length)
    req(input$type)
    req(input$event)

    tryCatch(
      {
        # Error for testing
        # stop("This is a test error.")

        # Get file path of the uploaded file
        file_path <- input$file$datapath

        quarto_task$invoke(file_path, temp_dir = tempdir())
      },
      error = function(e) {
        rlang::warn(paste(
          "Error when trying to invoke quarto_task:",
          e$message
        ))

        # Print stack trace
        print(rlang::trace_back())

        # Show modal to the user
        showModal(
          modalDialog(
            title = "Oops! Something went wrong",
            div(
              class = "text-center",
              bsicons::bs_icon(
                "emoji-frown-fill",
                size = "2em",
                class = "text-warning"
              ),
              br(),
              p(
                "The not so Shiny Side of LLMs. Please check that your Quarto presentation is valid and contains slides."
              )
            ),
            easyClose = TRUE,
            footer = modalButton("Close")
          )
        )
      }
    )
  }) |>
    bindEvent(input$submit)

  observe({
    req(quarto_task$result())
    tryCatch(
      {
        # Error for testing
        # stop("This is a test error.")

        # Get the Markdown file path from the completed quarto_task
        markdown_file <- quarto_task$result()
        # Read the generated Markdown file containing the slides
        markdown_content <- readChar(markdown_file, file.size(markdown_file))

        # Define prompt file
        system_prompt_file <- here::here(
          "prompts",
          "prompt-analyse-slides-structured-tool.md"
        )

        # Create system prompt
        system_prompt <- interpolate_file(
          path = system_prompt_file,
          audience = input$audience,
          length = input$length,
          type = input$type,
          event = input$event
        )

        # Trigger the chat task with the provided inputs
        chat_task$invoke(
          system_prompt = system_prompt,
          markdown_content = markdown_content,
          type_deck_analysis = type_deck_analysis
        )
      },
      error = function(e) {
        rlang::warn(paste(
          "Error when trying to invoke chat_task:",
          e$message
        ))

        # Print stack trace
        print(rlang::trace_back())

        # Show modal to the user
        showModal(
          modalDialog(
            title = "Oops! Something went wrong",
            div(
              class = "text-center",
              bsicons::bs_icon(
                "emoji-frown-fill",
                size = "2em",
                class = "text-warning"
              ),
              br(),
              p(
                "The not so Shiny Side of LLMs. Unfortunately, chatting didn't work out. Do you have enough credits left?"
              )
            ),
            easyClose = TRUE,
            footer = modalButton("Close")
          )
        )
      }
    )
  })

  # Reactive expression to hold the analysis result
  analysis_result <- reactive({
    named_list <- chat_task$result()

    make_frames(named_list)
  })

  output$results <- renderUI({
    if (quarto_task$status() == "running") {
      div(
        class = "text-center d-flex flex-column justify-content-center align-items-center",
        style = "height: 100%;",
        bsicons::bs_icon(
          "file-slides",
          size = "6em",
          class = "text-primary bounce"
        ),
        br(),
        p("Processing your Quarto presentation...")
      )
    } else if (chat_task$status() == "running") {
      div(
        class = "text-center d-flex flex-column justify-content-center align-items-center",
        style = "height: 100%;",
        bsicons::bs_icon(
          "robot",
          size = "6em",
          class = "text-primary bounce"
        ),
        br(),
        p("The LLM is doing its magic...")
      )
    } else if (chat_task$status() == "success") {
      tagList(
        layout_column_wrap(
          fill = FALSE,
          ### Value boxes for metrics
          value_box(
            title = tooltip(
              span(
                "Showtime ",
                bsicons::bs_icon("question-circle-fill")
              ),
              "Slides are being counted based on the provided Quarto presentation, then an educated guess is made about the time it will take to present them."
            ),
            value = textOutput("showtime"),
            showcase = bsicons::bs_icon("file-slides"),
            theme = "primary"
          ),
          value_box(
            title = tooltip(
              span(
                "Code Savviness ",
                bsicons::bs_icon("question-circle-fill")
              ),
              "Code Saviness is calculated based on the slides that contain code chunks. The percentage is the ratio of those slides to total slides."
            ),
            value = textOutput("code_savviness"),
            showcase = bsicons::bs_icon("file-code"),
            theme = "primary"
          ),
          value_box(
            title = tooltip(
              span(
                "Image Presence ",
                bsicons::bs_icon("question-circle-fill")
              ),
              "Image Presence is calculated based on the slides that contain images. The percentage is the ratio of those slides to total slides."
            ),
            value = textOutput("image_presence"),
            showcase = bsicons::bs_icon("file-image"),
            theme = "primary"
          )
        ),
        layout_column_wrap(
          fill = FALSE,
          width = 1 / 2,
          ### Graph with scoring metrics
          card(
            height = 600,
            card_header(
              strong("Scores per category")
            ),
            girafeOutput(
              outputId = "scores"
            )
          ),
          ### Table with suggested improvements
          card(
            height = 600,
            card_header(strong("Suggested improvements per category")),
            tableOutput(
              outputId = "suggested_improvements"
            )
          )
        )
      )
    }
  })

  output$scores <- renderGirafe({
    req(analysis_result())

    evals <- analysis_result()$evals

    # Order by score
    data <- evals |>
      arrange(score) |>
      mutate(
        category = factor(category, levels = category),
        tooltip = paste0(
          "Score: ",
          score,
          "\n",
          "After improvements: ",
          score_after_improvements,
          "\n",
          "Justification: ",
          justification
        )
      ) |>
      select(category, score, score_after_improvements, tooltip)

    p <- ggplot(
      data,
      aes(x = category, y = score, tooltip = tooltip, data_id = category)
    ) +
      geom_bar_interactive(
        stat = "identity",
        fill = "#18bc9c" # Success color of Flatly theme
      ) +
      labs(
        x = "Category",
        y = "Score"
      ) +
      # Flip to make horizontal bar chart
      coord_flip() +
      theme_minimal(base_family = "Lato", base_size = 14) +
      theme(legend.position = "none")

    girafe(
      ggobj = p,
      options = list(
        opts_selection(type = "none"),
        opts_sizing(rescale = TRUE),
        opts_tooltip(
          css = "background-color: #f0f0f0; color: #333; padding: 5px; border-radius: 5px; width: 200px;"
        ),
        opts_hover(
          css = "."
        ),
        opts_hover_inv(
          css = "opacity: 0.5;"
        )
      )
    )
  })

  output$suggested_improvements <- renderTable({
    req(analysis_result())

    evals <- analysis_result()$evals

    evals |>
      arrange(score) |>
      mutate(
        Gain = score_after_improvements - score
      ) |>
      select(
        Category = category,
        `Current score` = score,
        Improvements = improvements,
        `Score After Improvements` = score_after_improvements,
        Gain
      ) |>
      arrange(desc(Gain))
  })

  # Update value boxes based on analysis_result()$meta
  output$showtime <- renderText({
    req(analysis_result())
    paste0(
      analysis_result()$meta$estimated_duration_minutes,
      " minutes"
    )
  })

  output$code_savviness <- renderText({
    req(analysis_result())
    paste0(analysis_result()$meta$percent_with_code, " %")
  })

  output$image_presence <- renderText({
    req(analysis_result())
    paste0(analysis_result()$meta$percent_with_images, " %")
  })
}

shinyApp(ui, server)
|
Ready for the world: deployment#
TL;DR
There are various ways to make your Shiny app available to a wider audience via the web. Posit offers the following solutions:
We didn’t develop DeckCheck all for ourselves: we want to help every presenting Data Scientist with a polished presentation! So it’s time to put our Shiny app on the web. Luckily, there are a couple of main ways to do it:
- Cloud hosting: the “click-and-play” option
- Self-hosted deployments: the “I like control and flexibility” option
Cloud hosting is perfect if you just want your app to be live and don’t feel like babysitting a server (although babysitting can be fun!). A good place to start is Posit Connect Cloud
or shinyapps.io
. You push your code, and in a few clicks, your app has its own URL and is accessible to anyone with an internet connection. It’s fast, convenient, and you can scale if traffic grows.
Self-hosted give you full control and flexibility. Shiny Server
is a free and open source solution that lets you run Python or R Shiny apps in a controlled environment (e.g. on your own server). You decide when and how updates happen, how many users can connect, and whether to open the app to the public or keep it behind the corporate firewall. Posit Connect
takes that control a step further and wraps it in a professional enterprise solution: scheduling, user authentication, email notifications, and support for Shiny, FastAPI, Plumber, Quarto, and other popular Python and R frameworks.
In short: click-and-play = fast, simple, and ready to share. I-like-control = more setup, full flexibility, and enterprise-ready features. Either way, your Shiny app is ready for the world! And of course, beyond what’s mentioned here, there also many other solutions at any cloud service provider (Azure, AWS, GCP…).
Every series has its Shiny ending#
That’s the end of “The Shiny Side of LLMs”! Over three parts, you learned what an LLM actually is (and what it definitely isn’t), how to have a conversation with one using chatlas (Python) and ellmer (R), and how to make your ideas come to life in a Shiny app. Need some inspiration? Check out the Generative AI docs for Python
or the examples in the shinychat docs for R
.
I hope this series showed you the shiny side of LLMs, beyond the hype. My goal with this series was to make LLMs feel a little less like mysterious black boxes and a little more like tools you can actually use. Hopefully you’ve picked up a few tricks and now feel ready to try them out in your own work. I’m curious to see what you’ll create! Feel free to stay in touch via LinkedIn
.