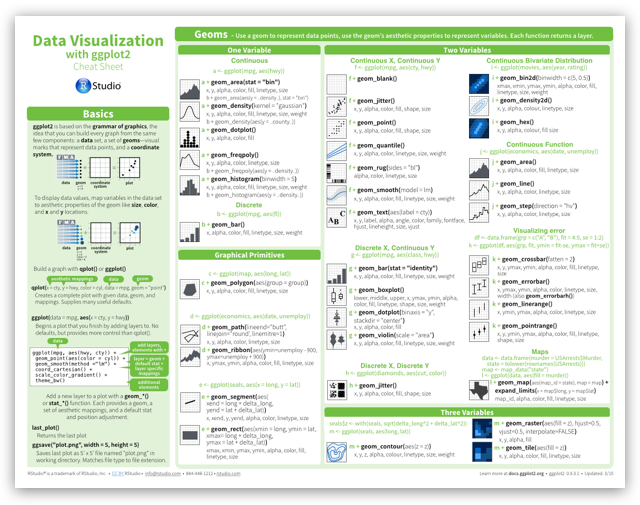
We’ve added a new cheatsheet to our collection . Data Visualization with ggplot2 describes how to build a plot with ggplot2 and the grammar of graphics. You will find helpful reminders of how to use:
-
geoms
-
stats
-
scales
-
coordinate systems
-
facets
-
position adjustments
-
legends, and
-
themes
The cheatsheet also documents tips on zooming.
Download the cheatsheet here .
Bonus - Frans van Dunné of Innovate Online has provided Spanish translations of the Data Wrangling, R Markdown, Shiny, and Package Development cheatsheets. Download them at the bottom of the cheatsheet gallery .