If you have tabular data (and who doesn’t?) this is the package for you! I’ve long been interested
in data quality and so I’ve spent a lot of time building tooling that makes it possible to perform
data quality checks. And there’s so many reasons to care about data quality. If I were to put down
just one good reason for why data quality is worth your time it is because having good data quality
strongly determines the quality of decisions.
Having the ability to distinguish bad data from good data is the first step in solving DQ issues,
and the sustained practice of doing data validation will guard against intrusions of poor-quality
data. Pointblank has been designed to really help here. Though it’s a fairly new package it is
currently quite capable. And it’s available in PyPI, so you can install it by using:
1
pip install pointblank
Note
To run the examples in this post, you’ll need to have a DataFrame library installed. Pointblank
works seamlessly with both Polars and Pandas but you’ll need to install at least one of them on your
own. We also have a DuckDB example that’s running via Ibis (so, you’ll have to install Ibis with
the DuckDB backend for that to work).
How Pointblank Transforms Your Data Validation Workflow#
What sets Pointblank apart is its intuitive, expressive approach to data validation. Rather than
writing dozens of ad-hoc checks scattered throughout your codebase, Pointblank lets you define a
comprehensive validation plan with just a few lines of code. The fluent API makes your validation
intentions crystal clear, whether you’re ensuring numeric values fall within expected ranges, text
fields match specific patterns, or relationships between columns remain consistent.
But say you find problems. What are you gonna do about it? Well, Pointblank wants to help at not
just finding problems but helping you understand them. When validation failures occur, the detailed
reporting capabilities (in the form of beautiful, sharable tables) show you exactly where issues
are. Right down to the specific rows and columns. This transforms data validation from a binary
pass/fail exercise into a super-insightful diagnostic tool.
Here’s the the best part: Pointblank is designed to work with your existing data stack. Whether
you’re using Polars, Pandas, DuckDB, or other database systems, Pointblank tries hard to integrate
without forcing you to change your workflow. We also have international spoken language support for
reporting, meaning that validation reports can be localized to your team’s preferred language. This
making data quality accessible to everyone in your organization (like a team sport!).
Alright! Let’s look at a few demonstrations of Pointblank’s capabilities for data validation.
2026-03-13 19:09:38 UTC< 1 s2026-03-13 19:09:38 UTC
There’s a lot to take in here so let’s break down the code first! Note these three key pieces:
the Validate(data=...) argument takes a DataFrame (or database table) that you want to validate
the methods starting with col_* specify validation steps that run on specific columns
the interrogate() method executes the validation plan on the table (it’s the finishing step)
This common pattern is used in a validation workflow, where
Validate
and
interrogate()
bookend a validation plan generated through calling validation methods.
Now, onto the result: it’s a table! Naturally, we’re using the awesome Great Tables package here in
Pointblank to really give you the goods on how the validation went down. Each row in this reporting
table represents a single validation step (one for each invocation of a col_vals_*() validation
method). Generally speaking, the left side of the validation report tables outlines the key
validation rules, and the right side provides the results of each validation step.
We tried to keep it simple in principle, but a lot of useful information can be packed into this
validation table. Here’s a diagram that describes a few of the important parts of the validation
report table:
All of those numbers under the UNITS, PASS, and FAIL columns have to do with test units, a
measure of central importance in Pointblank. Each validation step will execute a type of validation
test on the target table. For example, a
col_vals_lt()
validation step can test that each value in a column is less than a specified number. The key
finding that’s reported as a result of this test is the number of test units that pass or fail. This
little diagram explains what those numbers mean:
Failing test units can be tied to threshold levels, which can provide a better indication of whether
failures should raise some basic awareness or spur you into action. Here’s a validation workflow
that sets three failure threshold levels that signal the severity of data quality problems:
This data validation makes use of the many
validation methods available in the library
.
Because thresholds have been set at the Validate(thresholds=) parameter, we can now see where
certain validation steps have greater amounts of failures. Any validation steps with green
indicators passed with flying colors, whereas: (1) gray indicates the ‘warning’ condition was met
(at least one test unit failing), (2) yellow is for the ’error’ condition (20 or more test units
failing), and (3) red means ‘critical’ and that’s tripped when 10% of all test units are failing
ones.
Reporting tables are essential to the package and they help communicate what went wrong (or well) in
a validation workflow. Now let’s look at some additional reporting that Pointblank can give you to
better understand where things might’ve gone wrong.
The second validation step of the previous data validation showed 18 failing test units. That
translates to 18 spots in a 2,000 row DataFrame where a data quality assertion failed. We often
would like to know exactly what that failing data is; it’s usually the next step toward addressing
data quality issues.
Pointblank offers a method that gives you a tabular report on a specific step:
get_step_report()
.
The previous tables you’ve seen (the validation report table) dealt with providing a summary of all
validation steps. In contrast, a focused report on a single step can help to get to the heart of a data
quality issue. Here’s how that looks for Step 2:
1
validation_2.get_step_report(i=2)
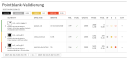
Report for Validation Step 2
ASSERTION session_duration > 5
18 / 2000 TEST UNIT FAILURES IN COLUMN 8
EXTRACT OF FIRST 10 ROWS (WITH TEST UNIT FAILURES IN RED):
player_id
String
session_id
String
session_start
Datetime
time
Datetime
item_type
String
item_name
String
item_revenue
Float64
session_duration
Float64
start_day
Date
acquisition
String
country
String
549
QNLVRDEOXFYJ892
QNLVRDEOXFYJ892-lz5fmr6k
2015-01-10 16:44:17+00:00
2015-01-10 16:45:29+00:00
iap
gold3
3.49
3.7
2015-01-09
crosspromo
Australia
620
RMOSWHJGELCI675
RMOSWHJGELCI675-t4y8bjcu
2015-01-11 07:24:24+00:00
2015-01-11 07:25:18+00:00
iap
offer4
17.991
5.0
2015-01-10
other_campaign
France
621
RMOSWHJGELCI675
RMOSWHJGELCI675-t4y8bjcu
2015-01-11 07:24:24+00:00
2015-01-11 07:26:24+00:00
iap
offer5
26.09
5.0
2015-01-10
other_campaign
France
622
RMOSWHJGELCI675
RMOSWHJGELCI675-t4y8bjcu
2015-01-11 07:24:24+00:00
2015-01-11 07:28:36+00:00
ad
ad_15sec
0.53
5.0
2015-01-10
other_campaign
France
663
GFLYJHAPMZWD631
GFLYJHAPMZWD631-i2v1bl7a
2015-01-11 16:13:24+00:00
2015-01-11 16:14:54+00:00
iap
gems2
3.99
3.6
2015-01-09
organic
India
772
BFNLURISJXTH647
BFNLURISJXTH647-6o5hx27z
2015-01-12 17:37:39+00:00
2015-01-12 17:39:27+00:00
iap
offer5
11.59
4.1
2015-01-10
organic
India
773
BFNLURISJXTH647
BFNLURISJXTH647-6o5hx27z
2015-01-12 17:37:39+00:00
2015-01-12 17:41:45+00:00
iap
gems3
9.99
4.1
2015-01-10
organic
India
908
KILWZYHRSJEG316
KILWZYHRSJEG316-uke7dhqj
2015-01-13 22:16:29+00:00
2015-01-13 22:17:35+00:00
iap
offer2
10.99
3.2
2015-01-04
organic
Denmark
1037
JUBDVFHCNQWT198
JUBDVFHCNQWT198-9h4xs2pb
2015-01-14 16:08:25+00:00
2015-01-14 16:08:43+00:00
iap
offer5
8.69
3.3
2015-01-14
organic
Philippines
1038
JUBDVFHCNQWT198
JUBDVFHCNQWT198-9h4xs2pb
2015-01-14 16:08:25+00:00
2015-01-14 16:11:01+00:00
iap
offer4
5.99
3.3
2015-01-14
organic
Philippines
This report provides the 18 rows where the failure occurred. If you scroll the table to the right
you’ll see the column that underwent testing (session_duration) is highlighted in red. All of
these values are 5.0 or less, which is in violation of the assertion (in the header) that
session_duration > 5.
These types of bespoke reports are useful for finding a needle in a haystack. Another good use for
a step report is when validating a table schema. Using the
col_schema_match()
validation method with a table schema prepared with the
Schema
class allows us to verify
our understanding of the table structure. Here is a validation that performs a schema validation
with the small_table dataset prepared as a DuckDB table:
importpointblankaspb# Create a schema for the target table (`small_table` as a DuckDB table)schema=pb.Schema(columns=[("date_time","timestamp(6)"),("dates","date"),("a","int64"),("b",),("c",),("d","float64"),("e",["bool","boolean"]),("f","str"),])# Use the `col_schema_match()` validation method to perform a schema checkvalidation_3=(pb.Validate(data=pb.load_dataset(dataset="small_table",tbl_type="duckdb"),tbl_name="small_table",label="Schema check").col_schema_match(schema=schema).interrogate())validation_3
The step report here shows the target table’s schema on the left side and the expectation of the
schema on the right side. There appears to be two problems with our supplied schema:
the second column is actually date instead of dates
the dtype of the f column is "string" and not "str"
The convenience of this step report means we only have to look at one display of information, rather
than having to collect up the individual pieces and make careful comparisons.
Pointblank tries really hard to make it easy for you to test your data. All sorts of input tables
are supported since we integrate with the brilliant
Narwhals
and
Ibis
libraries. And even through the project has only started four
months ago, we already have an extensive catalog of well-tested validation methods.
We care a great deal about documentation so much recent effort has been placed on getting the
User Guide
written. We hope it provides
for gentle introduction to the major features of the library. If you want some quick examples to get
your imagination going, check out our
gallery of examples
.
We really care about what you want in a validation package, so talk to us :) We just started a
Discord
so feel free to hop on and ask us anything.
Alternatively, we always like to get issues
so
don’t be shy in letting us know how we could improve!
Recently, Rich and I were poking around transit data, and we were struck by the amount of structuring that goes into transit timetables.
For example, consider this weekend rail schedule table from SEPTA, Philadelphia’s transit agency.
Notice these big pieces:
The vertical text on the left indicating trains are traveling “TO CENTER CITY”. The blue header, and spanner columns (“Services” and “Train Number”) grouping related columns. The striped background for easier reading. Also the black background indicating stations in Center City (the urban core). Tables like this often have to be created in tools like Illustrator, and updated by hand. At the same time, when agencies automate table creation, they often sacrifice a lot of the assistive features and helpful affordances of the table.